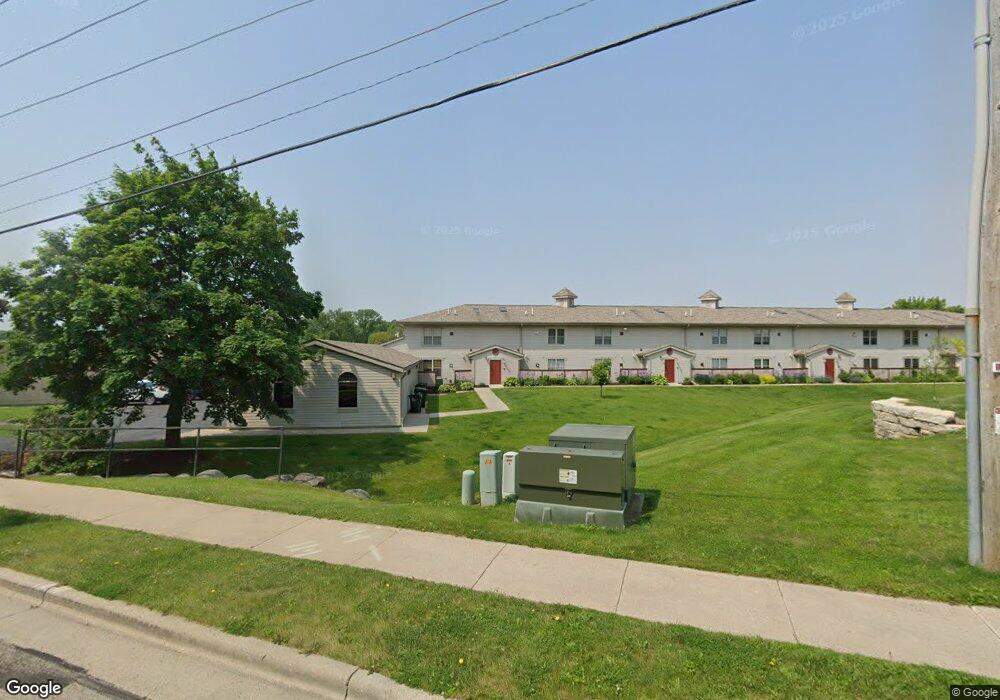
2313 Brewery Rd Unit R25 Cross Plains, WI 53528
Estimated Value: $210,482 - $288,000
2
Beds
1
Bath
--
Sq Ft
3.65
Acres
About This Home
This home is located at 2313 Brewery Rd Unit R25, Cross Plains, WI 53528 and is currently estimated at $236,121. 2313 Brewery Rd Unit R25 is a home located in Dane County with nearby schools including Park Elementary School, Glacier Creek Middle School, and Middleton High School.
Ownership History
Date
Name
Owned For
Owner Type
Purchase Details
Closed on
Apr 29, 2016
Sold by
Crook Keely M
Bought by
Gustafson Marty and Gustafson Robert
Current Estimated Value
Purchase Details
Closed on
Jul 17, 2009
Sold by
Reynolds Kraig D
Bought by
Crook Keely M
Home Financials for this Owner
Home Financials are based on the most recent Mortgage that was taken out on this home.
Original Mortgage
$97,200
Interest Rate
5.62%
Mortgage Type
Purchase Money Mortgage
Purchase Details
Closed on
Aug 15, 2008
Sold by
Us Bank Na Nd
Bought by
Reynolds Kraig D
Home Financials for this Owner
Home Financials are based on the most recent Mortgage that was taken out on this home.
Original Mortgage
$56,250
Interest Rate
6.31%
Mortgage Type
Purchase Money Mortgage
Purchase Details
Closed on
Jan 31, 2008
Sold by
Harris Brad A
Bought by
Us Bank Na Nd
Create a Home Valuation Report for This Property
The Home Valuation Report is an in-depth analysis detailing your home's value as well as a comparison with similar homes in the area
Home Values in the Area
Average Home Value in this Area
Purchase History
| Date | Buyer | Sale Price | Title Company |
|---|---|---|---|
| Gustafson Marty | $102,500 | Nations Title Agency Mn Inc | |
| Crook Keely M | $94,000 | None Available | |
| Reynolds Kraig D | $75,000 | Progressive Land Title Agenc | |
| Us Bank Na Nd | -- | None Available |
Source: Public Records
Mortgage History
| Date | Status | Borrower | Loan Amount |
|---|---|---|---|
| Previous Owner | Crook Keely M | $97,200 | |
| Previous Owner | Reynolds Kraig D | $56,250 |
Source: Public Records
Tax History Compared to Growth
Tax History
| Year | Tax Paid | Tax Assessment Tax Assessment Total Assessment is a certain percentage of the fair market value that is determined by local assessors to be the total taxable value of land and additions on the property. | Land | Improvement |
|---|---|---|---|---|
| 2024 | $2,016 | $102,000 | $15,000 | $87,000 |
| 2023 | $1,803 | $102,000 | $15,000 | $87,000 |
| 2021 | $1,823 | $102,000 | $15,000 | $87,000 |
| 2020 | $1,952 | $102,000 | $15,000 | $87,000 |
| 2019 | $1,897 | $102,000 | $15,000 | $87,000 |
| 2018 | $1,757 | $102,000 | $15,000 | $87,000 |
| 2017 | $1,896 | $95,200 | $10,800 | $84,400 |
| 2016 | $1,801 | $95,200 | $10,800 | $84,400 |
| 2015 | $1,886 | $95,200 | $10,800 | $84,400 |
| 2014 | $1,848 | $95,200 | $10,800 | $84,400 |
| 2013 | $1,793 | $95,200 | $10,800 | $84,400 |
Source: Public Records
Map
Nearby Homes
- 1772 Cornerstone Dr
- 2710 Military Rd Unit 2710
- 3606 Angelus Way
- 2015 Lewis St
- 2610 S Elmwood Cir W
- 2017 Main St
- 2007 Sylvia Pine Way
- 2712 Birchwood Pass
- 1775 Woodford Rd
- 1791 Woodford Rd
- 1774 Woodford Rd
- 2035 Continental Ln
- L38-L39 Thinnes St
- L36-L37 Thinnes St
- L34-L35 Thinnes St
- L32-L33 Thinnes St
- L40-L41 Thinnes St
- L9 Marchstone Blvd
- 2057 Glacier Cir
- The Cooper Plan at Creek Crossing
- 2301 Brewery Rd Unit R-28
- 2327 Brewery Rd Unit R-30
- 2307 Brewery Rd Unit R35
- 2319 Brewery Rd Unit 32
- 2305 Brewery Rd
- 2303 Brewery Rd
- 2307 Brewery Rd
- 2311 Brewery Rd Unit R34
- 2315 Brewery Rd Unit R33
- 2319 Brewery Rd
- 2323 Brewery Rd
- 2327 Brewery Rd
- 2331 Brewery Rd Unit R29
- 2309 Brewery Rd
- 2317 Brewery Rd
- 2321 Brewery Rd
- 2325 Brewery Rd
- 2329 Brewery Rd
- 2504 Church St
- 2506 Church St