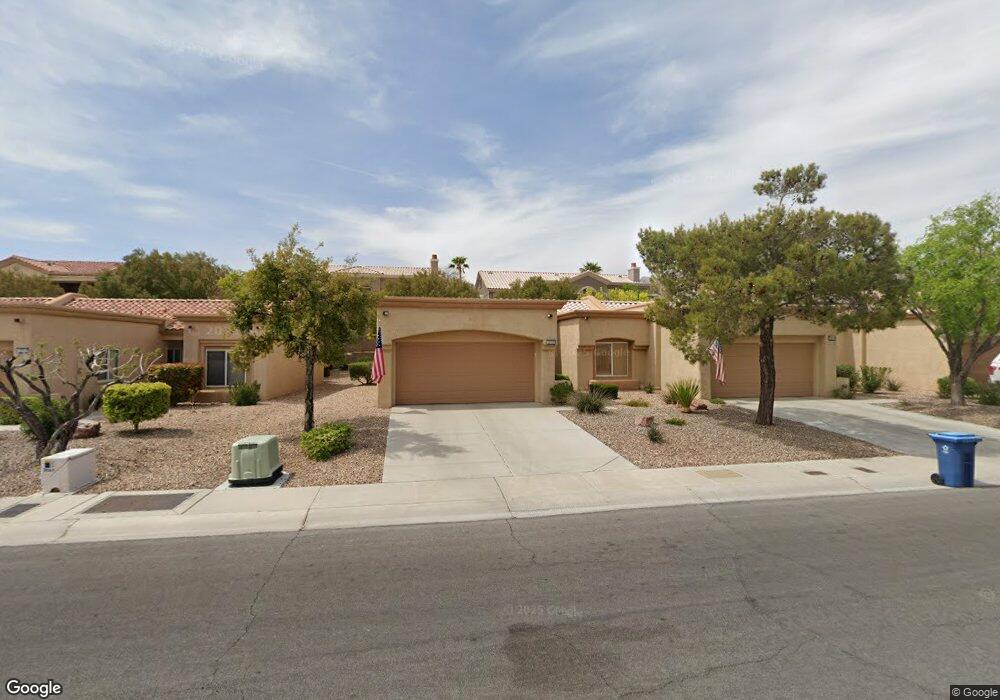
2313 Hallston St Las Vegas, NV 89134
Sun City Summerlin NeighborhoodEstimated Value: $344,000 - $378,000
2
Beds
2
Baths
1,201
Sq Ft
$302/Sq Ft
Est. Value
About This Home
This home is located at 2313 Hallston St, Las Vegas, NV 89134 and is currently estimated at $363,035, approximately $302 per square foot. 2313 Hallston St is a home located in Clark County with nearby schools including Ethel W. Staton Elementary School, Ernest Becker Middle School, and Palo Verde High School.
Ownership History
Date
Name
Owned For
Owner Type
Purchase Details
Closed on
Dec 7, 2011
Sold by
Schulz Henry W and Schulz Charlotte D
Bought by
Waldock John A and Waldock Arlene F
Current Estimated Value
Home Financials for this Owner
Home Financials are based on the most recent Mortgage that was taken out on this home.
Original Mortgage
$80,000
Outstanding Balance
$54,857
Interest Rate
4.06%
Mortgage Type
New Conventional
Estimated Equity
$308,178
Purchase Details
Closed on
Jun 17, 2000
Sold by
Olender Irene F
Bought by
Schulz Henry W and Schulz Charlotte D
Purchase Details
Closed on
Mar 29, 1996
Sold by
Olender Ronald W
Bought by
Olender Irene F
Purchase Details
Closed on
Mar 8, 1996
Sold by
Del Webb Communities Inc
Bought by
Olender Irene F and Feeney Patrick J
Create a Home Valuation Report for This Property
The Home Valuation Report is an in-depth analysis detailing your home's value as well as a comparison with similar homes in the area
Home Values in the Area
Average Home Value in this Area
Purchase History
| Date | Buyer | Sale Price | Title Company |
|---|---|---|---|
| Waldock John A | $110,000 | Ticor Title Las Vegas | |
| Schulz Henry W | $124,000 | First American Title Co | |
| Olender Irene F | -- | First American Title Co | |
| Olender Irene F | $119,000 | First American Title Co |
Source: Public Records
Mortgage History
| Date | Status | Borrower | Loan Amount |
|---|---|---|---|
| Open | Waldock John A | $80,000 |
Source: Public Records
Tax History Compared to Growth
Tax History
| Year | Tax Paid | Tax Assessment Tax Assessment Total Assessment is a certain percentage of the fair market value that is determined by local assessors to be the total taxable value of land and additions on the property. | Land | Improvement |
|---|---|---|---|---|
| 2025 | $1,398 | $79,326 | $32,550 | $46,776 |
| 2024 | $1,357 | $79,326 | $32,550 | $46,776 |
| 2023 | $1,111 | $71,808 | $28,700 | $43,108 |
| 2022 | $1,323 | $64,818 | $23,800 | $41,018 |
| 2021 | $1,383 | $55,984 | $22,050 | $33,934 |
| 2020 | $1,245 | $57,202 | $21,700 | $35,502 |
| 2019 | $1,209 | $54,557 | $19,250 | $35,307 |
| 2018 | $1,174 | $50,954 | $16,975 | $33,979 |
| 2017 | $1,513 | $47,922 | $14,700 | $33,222 |
| 2016 | $1,111 | $44,797 | $10,850 | $33,947 |
| 2015 | $1,109 | $42,141 | $8,750 | $33,391 |
| 2014 | $1,077 | $33,413 | $8,400 | $25,013 |
Source: Public Records
Map
Nearby Homes
- 2231 Hallston St
- 2401 Ocean Edge Ct
- 10404 Frostburg Ln
- 10321 Marymont Place
- 2413 Rockford St
- 10336 Frostburg Ln
- 10309 Georgetown Place
- 10309 Marymont Place
- 10413 Broom Hill Dr
- 10413 Willamette Place
- 10301 Coal Creek Place
- 10636 Argents Hill Dr
- 10300 Linfield Place
- 10620 Grand Cypress Ave
- 2501 Maddington Dr
- 2216 Spring Water Dr
- 10309 Broom Hill Dr
- 2241 Airlands St
- 2221 Grier Woods Ct
- 10409 Longwood Dr
- 2315 Hallston St
- 2311 Hallston St
- 2317 Hallston St
- 2309 Hallston St
- 2312 Sierra Heights Dr
- 2316 Sierra Heights Dr
- 2401 Hallston St
- 2307 Hallston St
- 10436 Marymont Place Unit 46
- 2308 Sierra Heights Dr
- 2403 Hallston St
- 10441 Georgetown Place
- 2400 Sierra Heights Dr
- 2305 Hallston St
- 2405 Hallston St
- 2303 Hallston St
- 10432 Marymont Place
- 10437 Marymont Place
- 2304 Sierra Heights Dr
- 10433 Georgetown Place