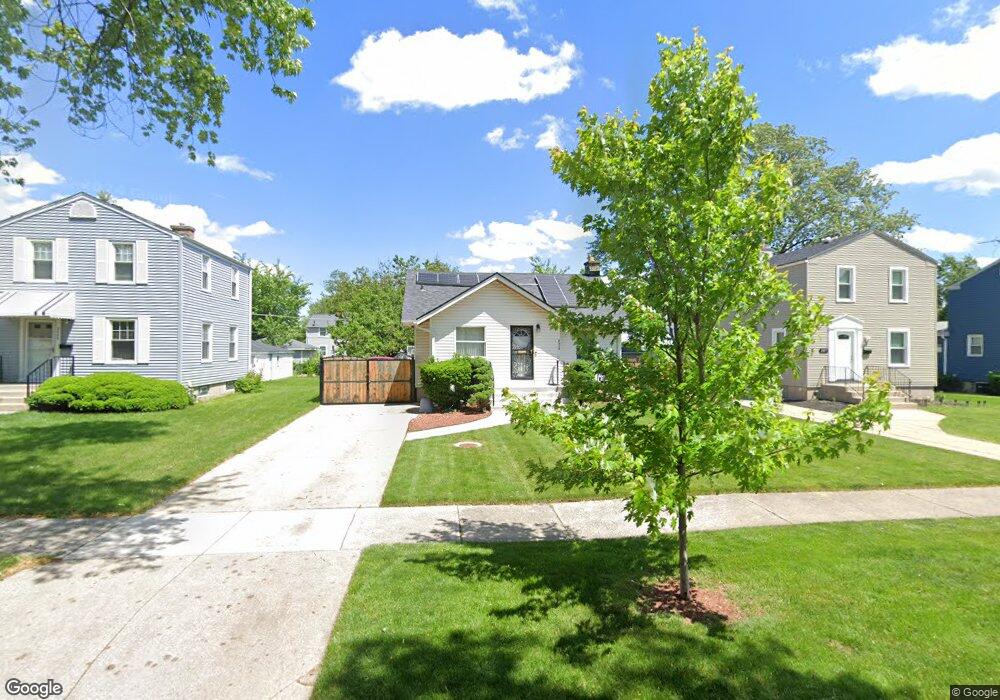
2313 S 13th Ave Broadview, IL 60155
Estimated Value: $258,000 - $284,000
2
Beds
2
Baths
1,045
Sq Ft
$258/Sq Ft
Est. Value
About This Home
This home is located at 2313 S 13th Ave, Broadview, IL 60155 and is currently estimated at $269,520, approximately $257 per square foot. 2313 S 13th Ave is a home located in Cook County with nearby schools including Lindop Elementary School, Proviso East High School, and Maywood Margery Daw Day Care.
Ownership History
Date
Name
Owned For
Owner Type
Purchase Details
Closed on
Sep 26, 2002
Sold by
Golebiowski Jan
Bought by
Skipper Greg and Skipper Carol
Current Estimated Value
Home Financials for this Owner
Home Financials are based on the most recent Mortgage that was taken out on this home.
Original Mortgage
$125,600
Outstanding Balance
$62,294
Interest Rate
9.31%
Estimated Equity
$207,226
Purchase Details
Closed on
Jan 31, 2002
Sold by
Bank One National Assn
Bought by
Golebiowski Jan
Purchase Details
Closed on
Sep 25, 2001
Sold by
Schick Raymond
Bought by
Bank One Na
Purchase Details
Closed on
Mar 22, 1999
Sold by
Schick Raymond and Allen William
Bought by
Schick Raymond
Home Financials for this Owner
Home Financials are based on the most recent Mortgage that was taken out on this home.
Original Mortgage
$117,000
Interest Rate
9.95%
Create a Home Valuation Report for This Property
The Home Valuation Report is an in-depth analysis detailing your home's value as well as a comparison with similar homes in the area
Home Values in the Area
Average Home Value in this Area
Purchase History
| Date | Buyer | Sale Price | Title Company |
|---|---|---|---|
| Skipper Greg | $157,000 | -- | |
| Golebiowski Jan | $96,500 | -- | |
| Bank One Na | -- | -- | |
| Schick Raymond | -- | -- |
Source: Public Records
Mortgage History
| Date | Status | Borrower | Loan Amount |
|---|---|---|---|
| Open | Skipper Greg | $125,600 | |
| Previous Owner | Schick Raymond | $117,000 | |
| Closed | Skipper Greg | $31,400 |
Source: Public Records
Tax History
| Year | Tax Paid | Tax Assessment Tax Assessment Total Assessment is a certain percentage of the fair market value that is determined by local assessors to be the total taxable value of land and additions on the property. | Land | Improvement |
|---|---|---|---|---|
| 2025 | $6,589 | $18,482 | $3,685 | $14,797 |
| 2024 | $6,589 | $18,482 | $3,685 | $14,797 |
| 2023 | $5,920 | $23,000 | $3,685 | $19,315 |
| 2022 | $5,920 | $17,696 | $2,680 | $15,016 |
| 2021 | $5,639 | $17,696 | $2,680 | $15,016 |
| 2020 | $5,558 | $17,696 | $2,680 | $15,016 |
| 2019 | $4,577 | $14,223 | $2,512 | $11,711 |
| 2018 | $4,578 | $14,223 | $2,512 | $11,711 |
| 2017 | $4,534 | $14,223 | $2,512 | $11,711 |
| 2016 | $3,561 | $10,621 | $2,345 | $8,276 |
| 2015 | $3,464 | $10,621 | $2,345 | $8,276 |
| 2014 | $3,408 | $10,621 | $2,345 | $8,276 |
| 2013 | $3,813 | $12,377 | $2,345 | $10,032 |
Source: Public Records
Map
Nearby Homes
- 2316 S 10th Ave
- 2218 S 11th Ave
- 2114 S 10th Ave
- 2433 S 17th Ave
- 2036 S 15th Ave
- 2510 S 17th Ave
- 2616 S 12th Ave
- 2001 S 11th Ave
- 2025 S 8th Ave
- 2105 S 7th Ave
- 1119 W Roosevelt Rd
- 2247 S 21st Ave
- 1911 S 11th Ave
- 2024 S 6th Ave
- 1918 S 9th Ave
- 1924 S 17th Ave
- 1917 S 9th Ave
- 1914 S 8th Ave
- 1830 S 11th Ave
- 2116 S 21st Ave
- 2309 S 13th Ave
- 2317 S 13th Ave
- 2305 S 13th Ave
- 2321 S 13th Ave
- 2312 S 12th Ave
- 2316 S 12th Ave
- 2308 S 12th Ave
- 2325 S 13th Ave
- 2301 S 13th Ave
- 2320 S 12th Ave
- 2304 S 12th Ave
- 2312 S 13th Ave
- 2324 S 12th Ave
- 2329 S 13th Ave
- 2300 S 12th Ave
- 2316 S 13th Ave
- 2308 S 13th Ave
- 2304 S 13th Ave
- 2320 S 13th Ave
- 2328 S 12th Ave
Your Personal Tour Guide
Ask me questions while you tour the home.