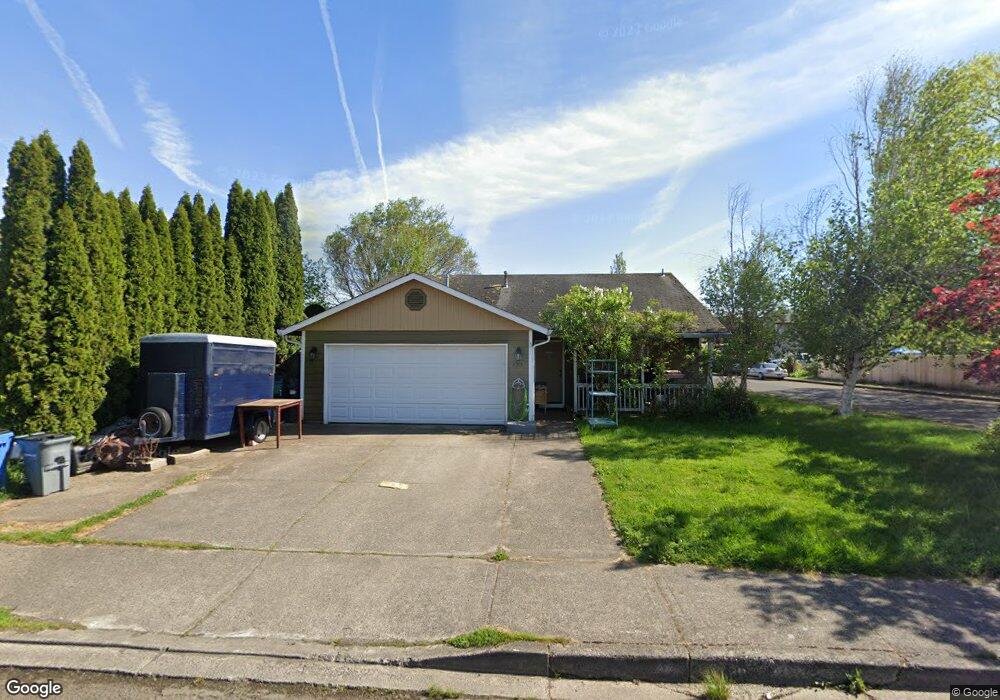
2313 SW 7th St Battle Ground, WA 98604
Estimated Value: $434,000 - $444,000
3
Beds
2
Baths
1,188
Sq Ft
$368/Sq Ft
Est. Value
About This Home
This home is located at 2313 SW 7th St, Battle Ground, WA 98604 and is currently estimated at $437,154, approximately $367 per square foot. 2313 SW 7th St is a home located in Clark County with nearby schools including Maple Grove Primary School, Prairie High School, and Firm Foundation Christian School.
Ownership History
Date
Name
Owned For
Owner Type
Purchase Details
Closed on
Aug 20, 2014
Sold by
Ritola Alex H and Ritola Lucinda
Bought by
Barrett Joseph A
Current Estimated Value
Home Financials for this Owner
Home Financials are based on the most recent Mortgage that was taken out on this home.
Original Mortgage
$203,979
Outstanding Balance
$155,592
Interest Rate
4.12%
Mortgage Type
New Conventional
Estimated Equity
$281,562
Purchase Details
Closed on
Nov 27, 2001
Sold by
Jones Ronald M and Jones Haley A
Bought by
Ritola Alex H
Home Financials for this Owner
Home Financials are based on the most recent Mortgage that was taken out on this home.
Original Mortgage
$125,032
Interest Rate
6.63%
Mortgage Type
FHA
Purchase Details
Closed on
Mar 1, 1996
Sold by
Tig Construction Llc
Bought by
Jones Ronald M and Jones Haley A
Home Financials for this Owner
Home Financials are based on the most recent Mortgage that was taken out on this home.
Original Mortgage
$100,869
Interest Rate
7%
Mortgage Type
FHA
Create a Home Valuation Report for This Property
The Home Valuation Report is an in-depth analysis detailing your home's value as well as a comparison with similar homes in the area
Home Values in the Area
Average Home Value in this Area
Purchase History
| Date | Buyer | Sale Price | Title Company |
|---|---|---|---|
| Barrett Joseph A | $199,619 | Chicago Title | |
| Ritola Alex H | $126,994 | Chicago Title Insurance | |
| Jones Ronald M | $101,798 | Charter Title Corp |
Source: Public Records
Mortgage History
| Date | Status | Borrower | Loan Amount |
|---|---|---|---|
| Open | Barrett Joseph A | $203,979 | |
| Previous Owner | Ritola Alex H | $125,032 | |
| Previous Owner | Jones Ronald M | $100,869 |
Source: Public Records
Tax History Compared to Growth
Tax History
| Year | Tax Paid | Tax Assessment Tax Assessment Total Assessment is a certain percentage of the fair market value that is determined by local assessors to be the total taxable value of land and additions on the property. | Land | Improvement |
|---|---|---|---|---|
| 2025 | $2,899 | $348,043 | $155,000 | $193,043 |
| 2024 | $2,525 | $356,163 | $155,000 | $201,163 |
| 2023 | $2,790 | $352,869 | $155,000 | $197,869 |
| 2022 | $2,780 | $355,676 | $131,750 | $223,926 |
| 2021 | $2,642 | $307,930 | $116,875 | $191,055 |
| 2020 | $2,260 | $268,445 | $97,750 | $170,695 |
| 2019 | $1,862 | $260,376 | $100,300 | $160,076 |
| 2018 | $2,161 | $251,143 | $0 | $0 |
| 2017 | $1,817 | $213,966 | $0 | $0 |
| 2016 | $1,814 | $195,977 | $0 | $0 |
| 2015 | $1,771 | $179,533 | $0 | $0 |
| 2014 | -- | $166,360 | $0 | $0 |
| 2013 | -- | $151,884 | $0 | $0 |
Source: Public Records
Map
Nearby Homes
- 2307 SW 5th Cir
- 2301 SW 5th Cir
- 2507 SW 5th Way
- 2111 SW 5th St
- 1019 SW 27th Ct
- 2514 W Main St
- 1816 SW 6th St
- 1711 SW 3rd St
- 1513 SW 6th St
- 1512 SW 5th St
- 502 SW 15th Ave
- 20204 NE 104th Ave
- 1807 NW 3rd St
- 0 W Main St Unit 793373106
- 0 W Main St Unit 261126278
- 344 NW 29th Way
- 0 NW 2nd St Unit 2 & 3 780233409
- 0 NW 2nd St Unit 3 282019710
- 0 NW 2nd St Unit 2 167106682
- 1608 NW 3rd St
- 2311 SW 7th St
- 2309 SW 7th St
- 2312 SW 8th St
- 2403 SW 7th St
- 2310 SW 8th St
- 702 SW 24th Ave
- 2307 SW 7th St
- 2312 SW 7th St
- 2310 SW 7th St
- 2308 SW 8th St
- 2308 SW 7th St
- 704 SW 24th Ave
- 2306 SW 8th St
- 2305 SW 7th St
- 2306 SW 7th St
- 604 SW 24th Ave
- 2304 SW 7th St
- 2303 SW 7th St
- 801 SW 24th Ave
- 2313 SW 6th St