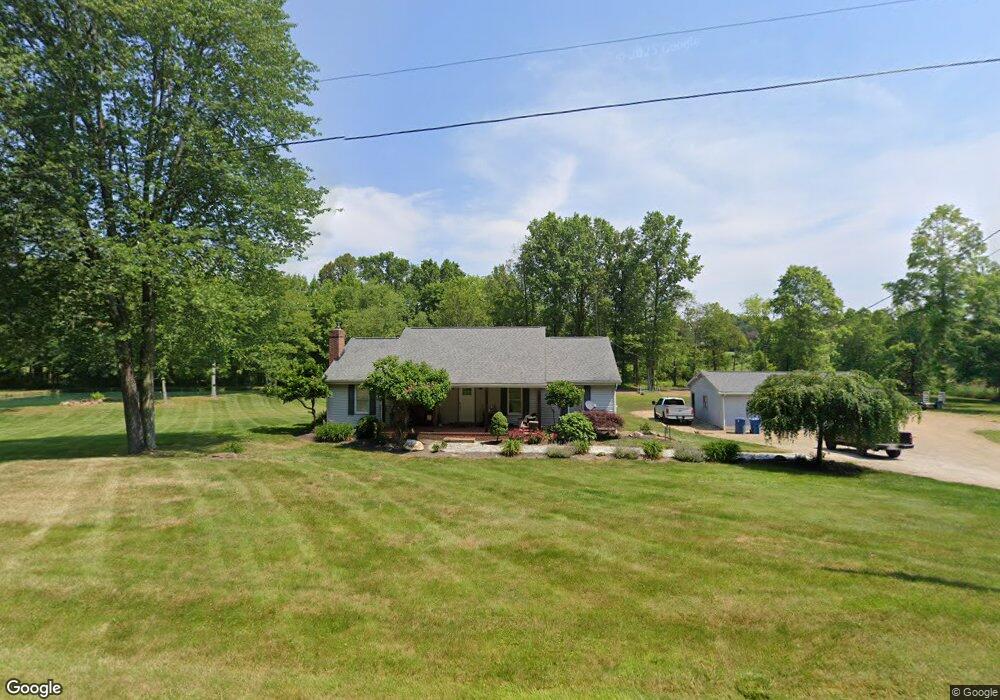
2313 W Comet Rd New Franklin, OH 44216
Estimated Value: $244,000 - $322,000
3
Beds
2
Baths
1,620
Sq Ft
$180/Sq Ft
Est. Value
About This Home
This home is located at 2313 W Comet Rd, New Franklin, OH 44216 and is currently estimated at $291,199, approximately $179 per square foot. 2313 W Comet Rd is a home located in Summit County with nearby schools including Northwest Primary School, W.S. Stinson Elementary School, and Northwest Middle School.
Ownership History
Date
Name
Owned For
Owner Type
Purchase Details
Closed on
Nov 17, 2003
Sold by
Bank One Na
Bought by
Burns Jason R
Current Estimated Value
Home Financials for this Owner
Home Financials are based on the most recent Mortgage that was taken out on this home.
Original Mortgage
$108,000
Outstanding Balance
$46,990
Interest Rate
5.12%
Mortgage Type
Purchase Money Mortgage
Estimated Equity
$244,209
Purchase Details
Closed on
Aug 11, 2003
Sold by
Rain Frank and Rain Frank R
Bought by
Bank One Na
Purchase Details
Closed on
May 1, 2000
Sold by
Gaynor Harry A and Gaynor Beverly J
Bought by
Reisinger Dawn and Rain Frank
Home Financials for this Owner
Home Financials are based on the most recent Mortgage that was taken out on this home.
Original Mortgage
$154,800
Interest Rate
10.37%
Create a Home Valuation Report for This Property
The Home Valuation Report is an in-depth analysis detailing your home's value as well as a comparison with similar homes in the area
Home Values in the Area
Average Home Value in this Area
Purchase History
| Date | Buyer | Sale Price | Title Company |
|---|---|---|---|
| Burns Jason R | $135,000 | Resource Title Agency Inc | |
| Bank One Na | $125,000 | -- | |
| Reisinger Dawn | $172,000 | Americas Choice Title Agency |
Source: Public Records
Mortgage History
| Date | Status | Borrower | Loan Amount |
|---|---|---|---|
| Open | Burns Jason R | $108,000 | |
| Previous Owner | Reisinger Dawn | $154,800 |
Source: Public Records
Tax History Compared to Growth
Tax History
| Year | Tax Paid | Tax Assessment Tax Assessment Total Assessment is a certain percentage of the fair market value that is determined by local assessors to be the total taxable value of land and additions on the property. | Land | Improvement |
|---|---|---|---|---|
| 2025 | $3,722 | $84,218 | $19,674 | $64,544 |
| 2024 | $3,722 | $84,218 | $19,674 | $64,544 |
| 2023 | $3,722 | $84,218 | $19,674 | $64,544 |
| 2022 | $3,069 | $63,021 | $14,574 | $48,447 |
| 2021 | $3,076 | $63,021 | $14,574 | $48,447 |
| 2020 | $3,085 | $63,020 | $14,570 | $48,450 |
| 2019 | $3,223 | $63,630 | $14,570 | $49,060 |
| 2018 | $3,221 | $63,630 | $14,570 | $49,060 |
| 2017 | $2,975 | $63,630 | $14,570 | $49,060 |
| 2016 | $3,001 | $54,480 | $14,570 | $39,910 |
| 2015 | $2,975 | $54,480 | $14,570 | $39,910 |
| 2014 | $3,106 | $54,480 | $14,570 | $39,910 |
| 2013 | $3,281 | $57,590 | $14,570 | $43,020 |
Source: Public Records
Map
Nearby Homes
- 2200 W Comet Rd
- 8177 S Cleveland Massillon Rd Unit 16
- 8177 S Cleveland Massillon Rd Unit 42
- 8941 Shoemaker Ave NW
- 7452 S Cleveland Massillon Rd
- 8113 Erie Ave NW
- 6387 Hampsher Rd
- 8089 Erie Ave NW
- 8055 Erie Ave NW
- 341 Alexis Ln
- 7985 Leaver Ave NW
- 765 Longview Ave
- 8714 Greenmeadow Ave NW
- 1062 Stump Rd
- 899 Loway Dr
- 6090 Manchester Rd Unit 6096
- Ballenger w/ Basement Plan at Heritage Village
- Columbia w/ Basement Plan at Heritage Village
- Allegheny w/ Basement Plan at Heritage Village
- Hudson w/ Basement Plan at Heritage Village
- 2310 W Comet Rd
- 2323 W Comet Rd
- 2260 W Comet Rd
- 2240 W Comet Rd
- 2353 W Comet Rd
- 2350 W Comet Rd
- 2365 W Comet Rd
- 2366 W Comet Rd
- 2377 W Comet Rd
- 2222 W Comet Rd
- 2380 W Comet Rd
- 2388 W Comet Rd
- 2383 W Comet Rd
- 2174 W Comet Rd
- 2399 W Comet Rd
- 2143 W Comet Rd
- 2411 W Comet Rd
- 2135 W Comet Rd
- 2427 W Comet Rd
- 2428 W Comet Rd