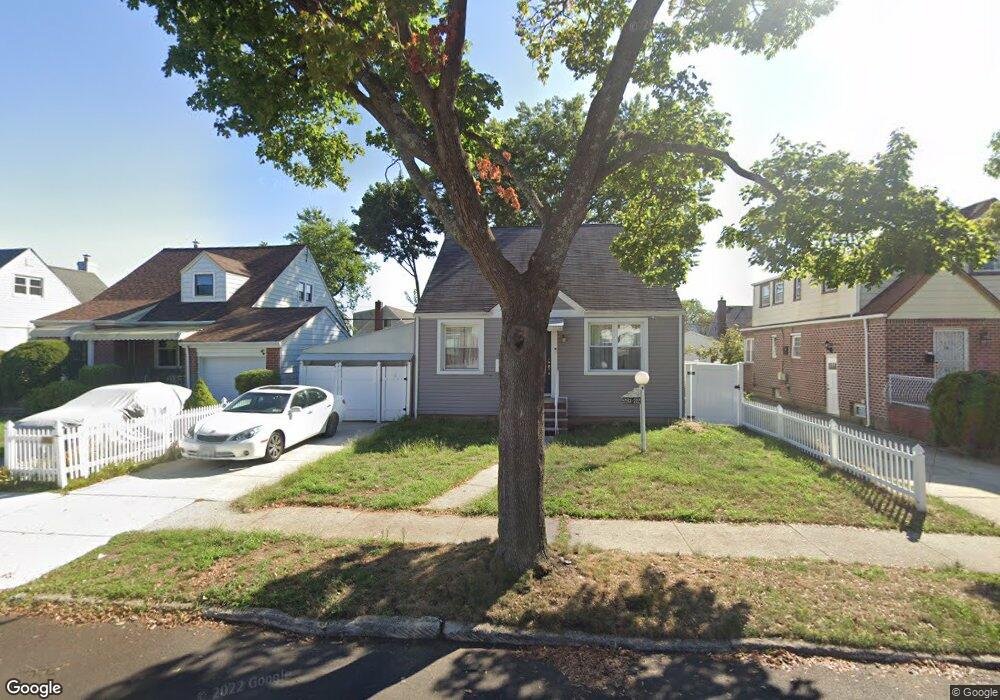
23132 128th Ave Springfield Gardens, NY 11413
Laurelton NeighborhoodEstimated Value: $713,550 - $852,000
--
Bed
--
Bath
1,188
Sq Ft
$659/Sq Ft
Est. Value
About This Home
This home is located at 23132 128th Ave, Springfield Gardens, NY 11413 and is currently estimated at $782,388, approximately $658 per square foot. 23132 128th Ave is a home located in Queens County with nearby schools including P.S. 176 Cambria Heights, Is 59 Springfield Gardens, and Cambria Center For The Gifted Child.
Ownership History
Date
Name
Owned For
Owner Type
Purchase Details
Closed on
Nov 14, 2019
Sold by
Ferreira Christina and Ferreira Laureano
Bought by
Casseus Marie C and Numa Fayla V
Current Estimated Value
Home Financials for this Owner
Home Financials are based on the most recent Mortgage that was taken out on this home.
Original Mortgage
$589,132
Outstanding Balance
$517,088
Interest Rate
3.7%
Mortgage Type
New Conventional
Estimated Equity
$265,300
Purchase Details
Closed on
Nov 28, 2006
Sold by
Sumpter Frances
Bought by
Laureano Christina and Laureano Louis
Home Financials for this Owner
Home Financials are based on the most recent Mortgage that was taken out on this home.
Original Mortgage
$412,000
Interest Rate
6.31%
Mortgage Type
Purchase Money Mortgage
Create a Home Valuation Report for This Property
The Home Valuation Report is an in-depth analysis detailing your home's value as well as a comparison with similar homes in the area
Home Values in the Area
Average Home Value in this Area
Purchase History
| Date | Buyer | Sale Price | Title Company |
|---|---|---|---|
| Casseus Marie C | $600,000 | -- | |
| Casseus Marie C | $600,000 | -- | |
| Laureano Christina | $415,000 | -- | |
| Laureano Christina | $415,000 | -- |
Source: Public Records
Mortgage History
| Date | Status | Borrower | Loan Amount |
|---|---|---|---|
| Open | Casseus Marie C | $589,132 | |
| Closed | Casseus Marie C | $589,132 | |
| Previous Owner | Laureano Christina | $412,000 |
Source: Public Records
Tax History Compared to Growth
Tax History
| Year | Tax Paid | Tax Assessment Tax Assessment Total Assessment is a certain percentage of the fair market value that is determined by local assessors to be the total taxable value of land and additions on the property. | Land | Improvement |
|---|---|---|---|---|
| 2025 | $6,659 | $35,141 | $10,672 | $24,469 |
| 2024 | $6,659 | $33,152 | $10,504 | $22,648 |
| 2023 | $6,282 | $31,277 | $10,443 | $20,834 |
| 2022 | $5,951 | $38,700 | $12,300 | $26,400 |
| 2021 | $6,273 | $33,120 | $12,300 | $20,820 |
| 2020 | $6,199 | $31,920 | $12,300 | $19,620 |
| 2019 | $5,486 | $31,980 | $12,300 | $19,680 |
| 2018 | $5,016 | $26,064 | $11,953 | $14,111 |
| 2017 | $4,764 | $24,840 | $11,599 | $13,241 |
| 2016 | $4,656 | $24,840 | $11,599 | $13,241 |
| 2015 | $2,607 | $24,404 | $13,637 | $10,767 |
| 2014 | $2,607 | $23,023 | $13,323 | $9,700 |
Source: Public Records
Map
Nearby Homes
- 231-15 128th Rd
- 23107 126th Ave
- 12831 233rd St
- 12819 234th St
- 129-08 Francis Lewis Blvd
- 12908 Francis Lewis Blvd
- 12810 236th St
- 130-20 232nd St
- 130-16 233rd St
- 120-42 231st St
- 120-51 234th St
- 0 235th St
- 120-43 234th St
- 234-16 130th Ave
- 12031 234th St
- 13001 228th St
- 120-47 228th St
- 233-6 131st Ave Unit 1
- 131-09 234th St Unit Lower Level
- 235-10 131st Ave Unit Upper
- 231-32 128th Ave
- 23136 128th Ave
- 23126 128th Ave
- 23126 128th Ave
- 231-22 128th Ave
- 23122 128th Ave
- 23140 128th Ave
- 231-40 128th Ave
- 23133 128th Rd
- 23127 128th Rd
- 23137 128th Rd
- 231-23 128th Rd
- 23123 128th Rd
- 231-18 128th Ave
- 23118 128th Ave
- 23141 128th Rd
- 23119 128th Rd
- 23131 128th Ave
- 23125 128th Ave
- 23135 128th Ave