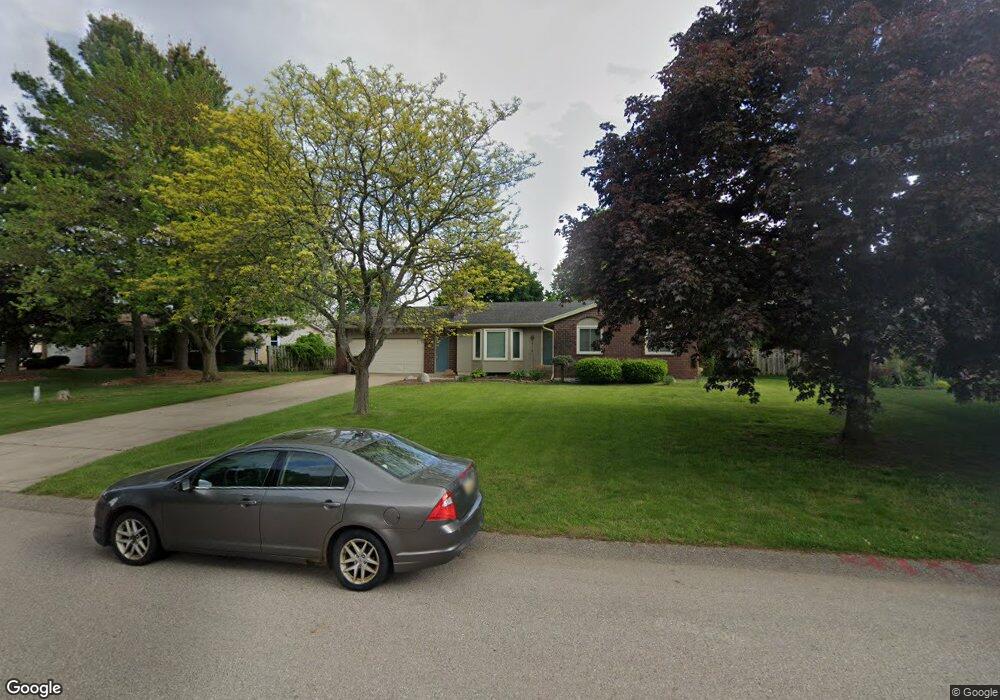
2314 Greendale Dr Jenison, MI 49428
Estimated Value: $326,000 - $345,000
3
Beds
2
Baths
1,337
Sq Ft
$251/Sq Ft
Est. Value
About This Home
This home is located at 2314 Greendale Dr, Jenison, MI 49428 and is currently estimated at $336,211, approximately $251 per square foot. 2314 Greendale Dr is a home located in Ottawa County with nearby schools including Rosewood Elementary School, Jenison Junior High School, and Jenison High School.
Ownership History
Date
Name
Owned For
Owner Type
Purchase Details
Closed on
Mar 14, 2022
Sold by
Prins Susan M
Bought by
Blue Stone Llc
Current Estimated Value
Home Financials for this Owner
Home Financials are based on the most recent Mortgage that was taken out on this home.
Original Mortgage
$167,200
Outstanding Balance
$134,804
Interest Rate
3.09%
Estimated Equity
$201,407
Purchase Details
Closed on
Dec 28, 2016
Sold by
Prins Susan
Bought by
Blue Stone Llc
Purchase Details
Closed on
Jul 14, 2015
Sold by
Plasman Margie H
Bought by
Prins Susan M
Home Financials for this Owner
Home Financials are based on the most recent Mortgage that was taken out on this home.
Original Mortgage
$110,800
Interest Rate
3.83%
Mortgage Type
New Conventional
Purchase Details
Closed on
Feb 5, 2008
Sold by
Plasman Margie H and Plasman Thomas J
Bought by
The Margie H Plasman Trust
Create a Home Valuation Report for This Property
The Home Valuation Report is an in-depth analysis detailing your home's value as well as a comparison with similar homes in the area
Home Values in the Area
Average Home Value in this Area
Purchase History
| Date | Buyer | Sale Price | Title Company |
|---|---|---|---|
| Blue Stone Llc | -- | Star Title | |
| Prins Susan M | -- | Star Title | |
| Blue Stone Llc | -- | Startitle Agency Llc | |
| Prins Susan M | $138,500 | None Available | |
| The Margie H Plasman Trust | -- | None Available |
Source: Public Records
Mortgage History
| Date | Status | Borrower | Loan Amount |
|---|---|---|---|
| Open | Prins Susan M | $167,200 | |
| Closed | Blue Stone Llc | $167,200 | |
| Previous Owner | Prins Susan M | $110,800 |
Source: Public Records
Tax History Compared to Growth
Tax History
| Year | Tax Paid | Tax Assessment Tax Assessment Total Assessment is a certain percentage of the fair market value that is determined by local assessors to be the total taxable value of land and additions on the property. | Land | Improvement |
|---|---|---|---|---|
| 2025 | $4,419 | $151,000 | $0 | $0 |
| 2024 | $4,062 | $136,200 | $0 | $0 |
| 2023 | $3,874 | $120,800 | $0 | $0 |
| 2022 | $4,014 | $113,500 | $0 | $0 |
| 2021 | $3,825 | $101,200 | $0 | $0 |
| 2020 | $3,790 | $99,800 | $0 | $0 |
| 2019 | $3,807 | $91,800 | $0 | $0 |
| 2018 | $3,615 | $85,400 | $0 | $0 |
| 2017 | $3,543 | $84,700 | $0 | $0 |
| 2016 | $3,534 | $77,000 | $0 | $0 |
| 2015 | $1,772 | $72,200 | $0 | $0 |
| 2014 | $1,772 | $69,000 | $0 | $0 |
Source: Public Records
Map
Nearby Homes
- 2323 Rosewood St
- 2200 Rosewood St
- 2194 Oak Hollow Dr
- 2101 Rosewood St
- 2159 Tyler St
- 6673 Cedargrove E Unit 141
- 2698 Cedargrove N
- 7342 Cherry Ave
- 7165 Keystone Ct
- 6714 Cedar Grove W
- 7107 Westwood Dr
- 6724 28th Ave
- 6794 N Wentward Ct Unit 149
- 7490 N Garden Ct
- 7502 22nd Ave
- 6722 N Wentward Ct Unit 77
- 7314 Pinegrove Dr
- 6725 N Wentward Ct
- 2921 N Wentward Ct
- 7373 Pinegrove Dr Unit 109
- 2300 Greendale Dr
- 2322 Greendale Dr
- 2289 Sugar Pine Ct
- 2303 Sugar Pine Ct
- 2270 Greendale Dr
- 2330 Greendale Dr
- 2315 Sugar Pine Ct
- 2311 Greendale Dr
- 2319 Greendale Dr
- 2301 Greendale Dr
- 2277 Sugar Pine Ct
- 2327 Greendale Dr
- 2329 Sugar Pine Ct
- 2262 Greendale Dr
- 2285 Greendale Dr
- 2276 Sugar Pine Ct
- 6920 Olde Pine Dr
- 6934 Olde Pine Dr
- 6906 Olde Pine Dr
- 2269 Greendale Dr