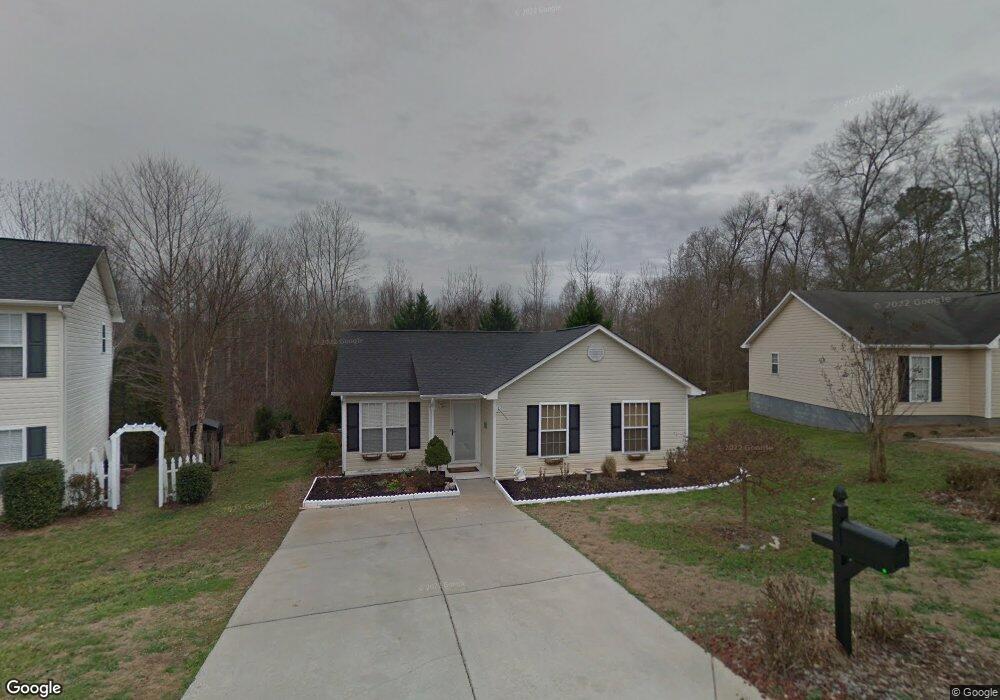
2314 Lomax Ct SE Concord, NC 28025
Estimated Value: $231,000 - $261,000
3
Beds
2
Baths
993
Sq Ft
$247/Sq Ft
Est. Value
About This Home
This home is located at 2314 Lomax Ct SE, Concord, NC 28025 and is currently estimated at $245,716, approximately $247 per square foot. 2314 Lomax Ct SE is a home located in Cabarrus County with nearby schools including W.M. Irvin Elementary School, Concord Middle School, and Concord High School.
Ownership History
Date
Name
Owned For
Owner Type
Purchase Details
Closed on
Mar 31, 2016
Sold by
Hinson Gary D and Hinson Nydia P
Bought by
Hinson Gary D and Hinson Nydia P
Current Estimated Value
Home Financials for this Owner
Home Financials are based on the most recent Mortgage that was taken out on this home.
Original Mortgage
$79,500
Outstanding Balance
$63,096
Interest Rate
3.65%
Mortgage Type
VA
Estimated Equity
$182,620
Purchase Details
Closed on
Mar 28, 2016
Sold by
High Amanda Page and High Jr Johnny Ray
Bought by
Hinson Gary D and Hinson Nydia P
Home Financials for this Owner
Home Financials are based on the most recent Mortgage that was taken out on this home.
Original Mortgage
$79,500
Outstanding Balance
$63,096
Interest Rate
3.65%
Mortgage Type
VA
Estimated Equity
$182,620
Purchase Details
Closed on
Oct 12, 1999
Sold by
Ray Morris Construction Inc
Bought by
Alexander Melvin B and Alexander Renee Lemley
Home Financials for this Owner
Home Financials are based on the most recent Mortgage that was taken out on this home.
Original Mortgage
$77,900
Interest Rate
7.75%
Create a Home Valuation Report for This Property
The Home Valuation Report is an in-depth analysis detailing your home's value as well as a comparison with similar homes in the area
Home Values in the Area
Average Home Value in this Area
Purchase History
| Date | Buyer | Sale Price | Title Company |
|---|---|---|---|
| Hinson Gary D | -- | None Available | |
| Hinson Gary D | $106,000 | None Available | |
| Alexander Melvin B | $82,000 | -- |
Source: Public Records
Mortgage History
| Date | Status | Borrower | Loan Amount |
|---|---|---|---|
| Open | Hinson Gary D | $79,500 | |
| Previous Owner | Alexander Melvin B | $77,900 |
Source: Public Records
Tax History Compared to Growth
Tax History
| Year | Tax Paid | Tax Assessment Tax Assessment Total Assessment is a certain percentage of the fair market value that is determined by local assessors to be the total taxable value of land and additions on the property. | Land | Improvement |
|---|---|---|---|---|
| 2025 | $2,171 | $218,000 | $42,400 | $175,600 |
| 2024 | $2,171 | $218,000 | $42,400 | $175,600 |
| 2023 | $1,521 | $132,690 | $32,000 | $100,690 |
| 2022 | $1,521 | $124,690 | $32,000 | $92,690 |
| 2021 | $1,521 | $124,690 | $32,000 | $92,690 |
| 2020 | $1,521 | $124,690 | $32,000 | $92,690 |
| 2019 | $1,153 | $94,500 | $24,000 | $70,500 |
| 2018 | $1,134 | $94,500 | $24,000 | $70,500 |
| 2017 | $1,115 | $94,500 | $24,000 | $70,500 |
| 2016 | $662 | $93,570 | $28,000 | $65,570 |
| 2015 | $1,104 | $93,570 | $28,000 | $65,570 |
| 2014 | $1,104 | $93,570 | $28,000 | $65,570 |
Source: Public Records
Map
Nearby Homes
- 1146 Crestmont Dr SE
- 1076 Tangle Ridge Dr SE
- 2406 Everton Cir SE
- 1128 Tangle Ridge Dr SE
- 2625 Old Airport Rd
- 1197 Tangle Ridge Dr SE
- 1508 Thompson Dr
- 1121 Setter Ln SE
- 153 Cottontail Ln SE Unit 46
- 2314 Fairport Dr SE
- 271 Ikerd Dr SE
- 2365 Baxter Place SE
- 2369 Baxter Place SE
- 301 Rosemont Ave SE
- 768 Millbrook Ct
- 46 Donna Dale Ave SE
- 368 Pleasant Hill Dr SE
- 51 Plott Dr SW
- 780 Marble St SE
- 797 Oak Manor Dr SE
- 2318 Lomax Ct SE
- 2310 Lomax Ct SE
- 2310 Lomax Ct SE Unit 3
- 2322 Lomax Ct SE
- 2306 Lomax Ct SE
- 2305 Lomax Ct SE
- 2315 Lomax Ct SE
- 2302 Lomax Ct SE
- 2323 Lomax Ct SE
- 2326 Lomax Ct SE
- 2327 Lomax Ct SE
- 2330 Lomax Ct SE
- 2338 Lomax Ct SE
- 2334 Lomax Ct SE
- 2331 Lomax Ct SE
- 1164 Crestmont Dr SE
- 1164 Crestmont Dr SE Unit 1164
- 1164 Crestmont Dr SE Unit A-1
- 1079 Crestmont Dr SE
- 1100 Crestmont Dr SE