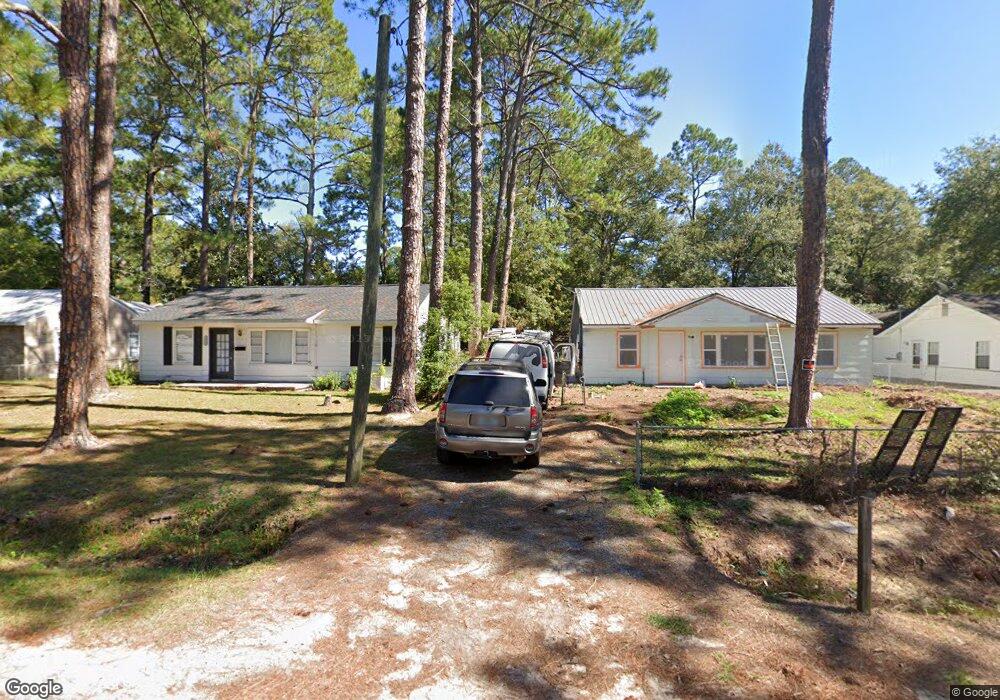
2314 Spurgeon St Waycross, GA 31501
Estimated Value: $73,000 - $85,000
3
Beds
2
Baths
1,084
Sq Ft
$73/Sq Ft
Est. Value
About This Home
This home is located at 2314 Spurgeon St, Waycross, GA 31501 and is currently estimated at $79,023, approximately $72 per square foot. 2314 Spurgeon St is a home located in Ware County with nearby schools including Center Elementary School, Waycross Middle School, and Ware County High School.
Ownership History
Date
Name
Owned For
Owner Type
Purchase Details
Closed on
Aug 31, 2021
Sold by
Sullins Karen P
Bought by
Lesene Emmanuel O
Current Estimated Value
Home Financials for this Owner
Home Financials are based on the most recent Mortgage that was taken out on this home.
Original Mortgage
$48,925
Outstanding Balance
$44,452
Interest Rate
2.7%
Mortgage Type
New Conventional
Estimated Equity
$34,571
Purchase Details
Closed on
Sep 22, 2008
Sold by
Sullins Jeanne E
Bought by
Sullins Charles W
Purchase Details
Closed on
Apr 20, 2006
Sold by
Thornton Lois E
Bought by
Sullins Jeanne E
Purchase Details
Closed on
Mar 29, 2005
Sold by
Howell Danny
Bought by
Thornton Lois E and Tanner Teresa T
Purchase Details
Closed on
Apr 1, 1987
Create a Home Valuation Report for This Property
The Home Valuation Report is an in-depth analysis detailing your home's value as well as a comparison with similar homes in the area
Home Values in the Area
Average Home Value in this Area
Purchase History
| Date | Buyer | Sale Price | Title Company |
|---|---|---|---|
| Lesene Emmanuel O | $51,500 | -- | |
| Sullins Charles W | -- | -- | |
| Sullins Jeanne E | $49,000 | -- | |
| Thornton Lois E | $17,000 | -- | |
| Howell Danny | $14,000 | -- | |
| -- | $20,000 | -- |
Source: Public Records
Mortgage History
| Date | Status | Borrower | Loan Amount |
|---|---|---|---|
| Open | Lesene Emmanuel O | $48,925 |
Source: Public Records
Tax History Compared to Growth
Tax History
| Year | Tax Paid | Tax Assessment Tax Assessment Total Assessment is a certain percentage of the fair market value that is determined by local assessors to be the total taxable value of land and additions on the property. | Land | Improvement |
|---|---|---|---|---|
| 2024 | $1,174 | $24,523 | $2,100 | $22,423 |
| 2023 | $846 | $14,431 | $960 | $13,471 |
| 2022 | $575 | $14,431 | $960 | $13,471 |
| 2021 | $469 | $10,853 | $960 | $9,893 |
| 2020 | $741 | $16,992 | $960 | $16,032 |
| 2019 | $590 | $13,342 | $960 | $12,382 |
| 2018 | $0 | $12,691 | $960 | $11,731 |
| 2017 | -- | $12,691 | $960 | $11,731 |
| 2016 | -- | $12,691 | $960 | $11,731 |
| 2015 | -- | $12,690 | $960 | $11,731 |
| 2014 | -- | $12,691 | $960 | $11,731 |
| 2013 | -- | $12,690 | $960 | $11,730 |
Source: Public Records
Map
Nearby Homes
- 2312 Spurgeon St
- 607 Linden Dr
- 2509 Tebeau St
- 515 Summit St
- 2120 Tebeau St
- 904 Golfview Dr
- 2202 Pioneer St
- 2123 Sunnyside Dr
- 601 Community Dr
- 2099 Ridge Rd
- 2022 Pioneer St
- 00 Pineview Dr
- 0 Pineview Dr
- 1013 E Waring St
- 0 Beville St
- 1301 Riverside Ave
- 2706 Alice St
- 404 Community Dr
- .22 Alice St
- 2108 Screven Ave
- 2316 Spurgeon St
- 2318 Spurgeon St
- 2310 Spurgeon St
- 2313 Eastover Dr
- 2315 Eastover Dr
- 2311 Eastover Dr
- 2308 Spurgeon St
- 2322 Spurgeon St
- 2315 Spurgeon St
- 2309 Eastover Dr
- 2317 Eastover Dr
- 2313 Spurgeon St
- 2319 Spurgeon St
- 2319 Eastover Dr
- 2311 Spurgeon St
- 2307 Eastover Dr
- 2306 Spurgeon St
- 2321 Eastover Dr
- 2321 Spurgeon St
- 2309 Spurgeon St