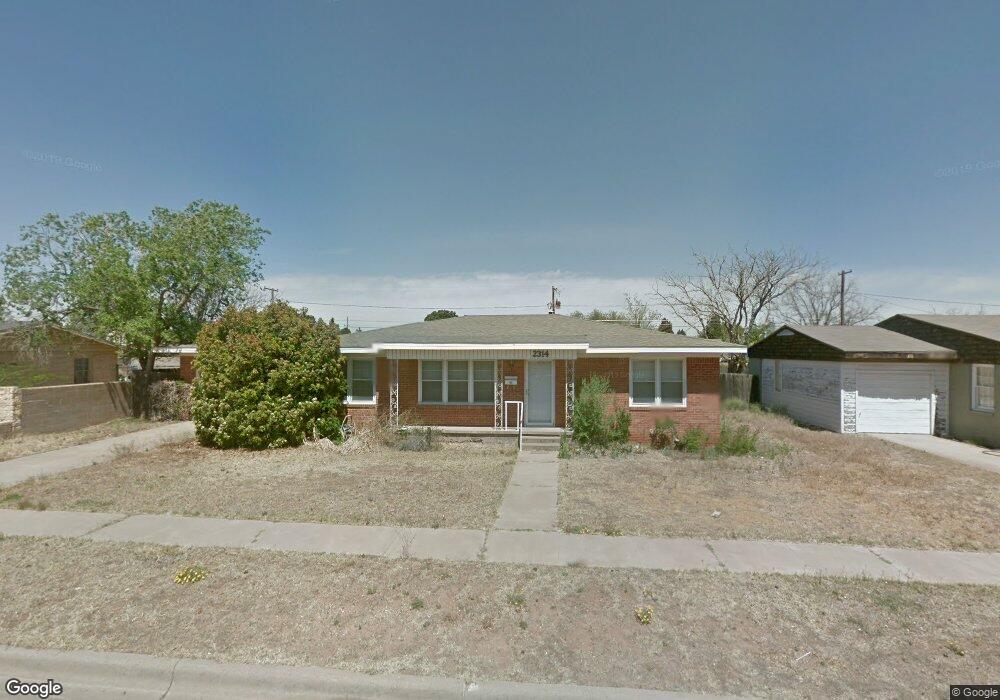
2314 Storey Ave Midland, TX 79701
Estimated Value: $183,000 - $238,000
3
Beds
1
Bath
1,362
Sq Ft
$153/Sq Ft
Est. Value
About This Home
This home is located at 2314 Storey Ave, Midland, TX 79701 and is currently estimated at $208,032, approximately $152 per square foot. 2314 Storey Ave is a home located in Midland County with nearby schools including Midland High School, Sam Houston Collegiate Preparatory Elementary School, and First Baptist Child Development Center.
Ownership History
Date
Name
Owned For
Owner Type
Purchase Details
Closed on
Oct 29, 2024
Sold by
Fragoso Katie
Bought by
Breeding Landon and Breeding Cassandra
Current Estimated Value
Home Financials for this Owner
Home Financials are based on the most recent Mortgage that was taken out on this home.
Original Mortgage
$144,000
Outstanding Balance
$142,410
Interest Rate
6.09%
Mortgage Type
New Conventional
Estimated Equity
$65,622
Purchase Details
Closed on
Jun 1, 2019
Sold by
Cecil Willa Dean
Bought by
Dean Cecil Willa
Purchase Details
Closed on
Feb 12, 2016
Sold by
Roye James P
Bought by
Fragoso Katie
Home Financials for this Owner
Home Financials are based on the most recent Mortgage that was taken out on this home.
Original Mortgage
$127,153
Interest Rate
4.05%
Mortgage Type
FHA
Purchase Details
Closed on
Oct 20, 1983
Bought by
Fragoso Katie
Create a Home Valuation Report for This Property
The Home Valuation Report is an in-depth analysis detailing your home's value as well as a comparison with similar homes in the area
Home Values in the Area
Average Home Value in this Area
Purchase History
| Date | Buyer | Sale Price | Title Company |
|---|---|---|---|
| Breeding Landon | -- | West Texas Abstract & Title | |
| Dean Cecil Willa | -- | Lone Star Abstract & Ttl Co | |
| Fragoso Katie | $127,153 | Lone Star Abstract & Title C | |
| Fragoso Katie | -- | -- |
Source: Public Records
Mortgage History
| Date | Status | Borrower | Loan Amount |
|---|---|---|---|
| Open | Breeding Landon | $144,000 | |
| Previous Owner | Fragoso Katie | $127,153 |
Source: Public Records
Tax History Compared to Growth
Tax History
| Year | Tax Paid | Tax Assessment Tax Assessment Total Assessment is a certain percentage of the fair market value that is determined by local assessors to be the total taxable value of land and additions on the property. | Land | Improvement |
|---|---|---|---|---|
| 2025 | $1,285 | $144,000 | $21,060 | $122,940 |
| 2024 | $1,288 | $151,750 | $21,060 | $130,690 |
| 2023 | $1,078 | $147,110 | $21,060 | $126,050 |
| 2022 | $1,974 | $126,350 | $21,060 | $105,290 |
| 2021 | $2,034 | $116,780 | $21,060 | $95,720 |
| 2020 | $1,616 | $117,200 | $21,060 | $96,140 |
| 2019 | $2,219 | $117,200 | $21,060 | $96,140 |
| 2018 | $2,209 | $113,610 | $21,060 | $92,550 |
| 2017 | $2,253 | $115,850 | $21,060 | $94,790 |
| 2016 | $1,754 | $98,040 | $21,060 | $95,450 |
| 2015 | -- | $89,130 | $21,060 | $68,070 |
| 2014 | -- | $88,210 | $0 | $0 |
Source: Public Records
Map
Nearby Homes
- 1307 W Kansas Ave
- 1208 W Kansas Ave
- 2208 Bedford Dr
- 2009 Bedford Dr
- 2008 Bedford Dr
- 2001 Country Club Dr
- 2203 Princeton Ave
- 1501 Bedford Dr
- 2008 Harvard Ave
- 2610 Storey Ave
- 5921 Zin Valle
- 2613 Storey Ave
- 2011 Community Ln
- 1422 Lanham St
- 6716 S County Road 1160 Unit A
- 1426 Lanham St
- 1602 Country Club Dr
- 2003 Community Ln
- 1604 N N St
- 225 E Circle Dr
- 2312 Storey Ave
- 2316 Storey Ave
- 2310 Storey Ave
- 2315 W Cuthbert Ave
- 2317 W Cuthbert Ave
- 2313 W Cuthbert Ave
- 2315 Storey Ave
- 2317 Storey Ave
- 2308 Storey Ave
- 2313 Storey Ave
- 2319 Storey Ave
- 2400 Storey Ave
- 2311 Storey Ave
- 2311 W Cuthbert Ave
- 2306 Storey Ave
- 2401 W Cuthbert Ave
- 2309 Storey Ave
- 2401 Storey Ave
- 2402 Storey Ave
- 2307 W Cuthbert Ave