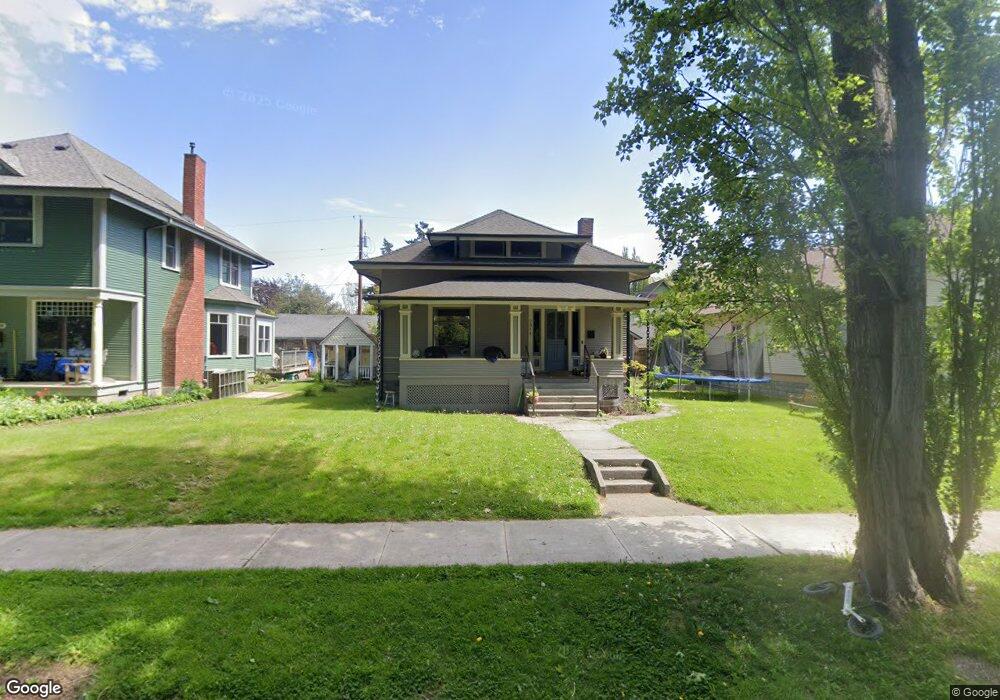
2314 Utter St Bellingham, WA 98225
Columbia NeighborhoodEstimated Value: $777,647 - $912,000
3
Beds
2
Baths
1,785
Sq Ft
$471/Sq Ft
Est. Value
About This Home
This home is located at 2314 Utter St, Bellingham, WA 98225 and is currently estimated at $840,912, approximately $471 per square foot. 2314 Utter St is a home located in Whatcom County with nearby schools including Columbia Elementary School, Whatcom Middle School, and Bellingham High School.
Ownership History
Date
Name
Owned For
Owner Type
Purchase Details
Closed on
Dec 10, 2009
Sold by
Eldridge Craftsman Llc
Bought by
Gill Gary E
Current Estimated Value
Purchase Details
Closed on
Jul 26, 2007
Sold by
Gill Gary E
Bought by
Eldridge Craftsman Llc
Purchase Details
Closed on
Mar 7, 2005
Sold by
Eldridge Craftsman Llc
Bought by
Gill Gary E
Purchase Details
Closed on
Jul 30, 2004
Sold by
Gill Gary E
Bought by
Eldridge Craftsman Llc
Create a Home Valuation Report for This Property
The Home Valuation Report is an in-depth analysis detailing your home's value as well as a comparison with similar homes in the area
Home Values in the Area
Average Home Value in this Area
Purchase History
| Date | Buyer | Sale Price | Title Company |
|---|---|---|---|
| Gill Gary E | -- | None Available | |
| Eldridge Craftsman Llc | -- | None Available | |
| Gill Gary E | -- | -- | |
| Eldridge Craftsman Llc | -- | -- |
Source: Public Records
Tax History Compared to Growth
Tax History
| Year | Tax Paid | Tax Assessment Tax Assessment Total Assessment is a certain percentage of the fair market value that is determined by local assessors to be the total taxable value of land and additions on the property. | Land | Improvement |
|---|---|---|---|---|
| 2024 | $6,204 | $777,535 | $270,928 | $506,607 |
| 2023 | $6,204 | $797,325 | $277,824 | $519,501 |
| 2022 | $4,606 | $687,351 | $239,504 | $447,847 |
| 2021 | $4,519 | $495,918 | $172,800 | $323,118 |
| 2020 | $4,675 | $459,183 | $160,000 | $299,183 |
| 2019 | $4,185 | $459,080 | $124,778 | $334,302 |
| 2018 | $4,214 | $412,073 | $112,028 | $300,045 |
| 2017 | $3,638 | $354,783 | $96,450 | $258,333 |
| 2016 | $3,182 | $320,098 | $86,550 | $233,548 |
| 2015 | $3,120 | $291,439 | $79,050 | $212,389 |
| 2014 | -- | $276,508 | $75,000 | $201,508 |
| 2013 | -- | $270,780 | $73,500 | $197,280 |
Source: Public Records
Map
Nearby Homes
- 2218 Jaeger St
- 1410 J St
- 1315 Astor St
- 1800 J St
- 2600 Elm St
- 2500 Meridian St
- 1200 W Holly St
- 2805 Walnut St
- 3018 Elm St
- 3008 Meridian St
- 1025 Granary Ave Unit 503
- 1025 Granary Ave Unit 404
- 1025 Granary Ave Unit 306
- 1025 Granary Ave Unit 506
- 1025 Granary Ave Unit 501-A
- 1025 Granary Ave Unit 307-B
- 1025 Granary Ave Unit 408
- 1025 Granary Ave Unit 407
- 1025 Granary Ave Unit 505
- 1025 Granary Ave Unit 308