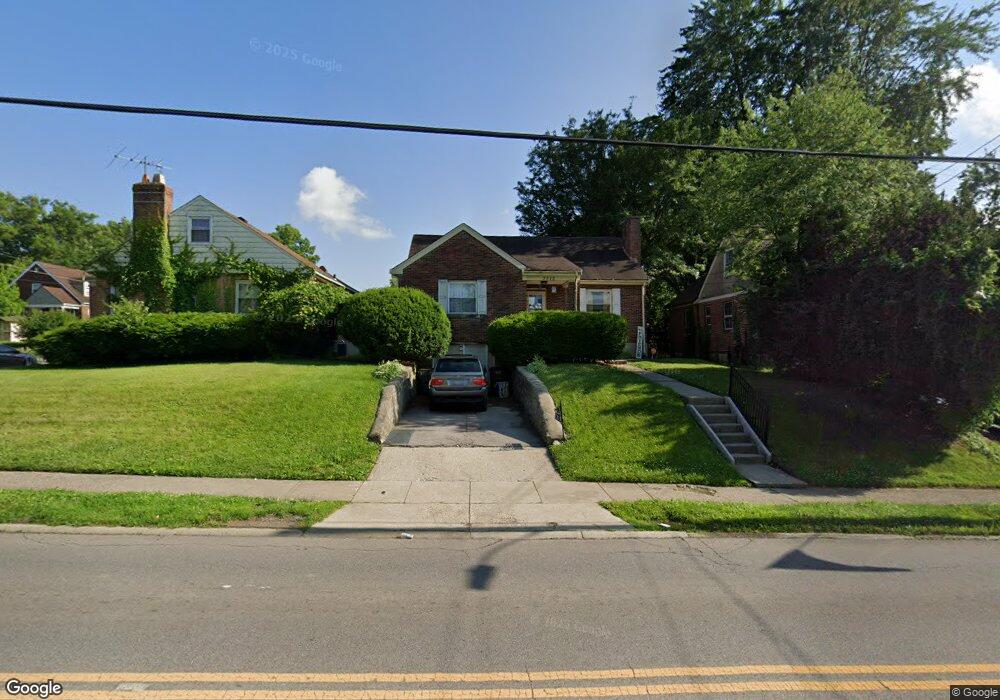
2315 Losantiville Ave Cincinnati, OH 45237
Estimated Value: $146,000 - $259,000
3
Beds
1
Bath
1,451
Sq Ft
$152/Sq Ft
Est. Value
About This Home
This home is located at 2315 Losantiville Ave, Cincinnati, OH 45237 and is currently estimated at $220,407, approximately $151 per square foot. 2315 Losantiville Ave is a home located in Hamilton County with nearby schools including Pleasant Ridge Montessori School, Shroder High School, and Clark Montessori High School.
Ownership History
Date
Name
Owned For
Owner Type
Purchase Details
Closed on
Nov 25, 2016
Sold by
Essex Pamela and Essex Darrell
Bought by
Essex Pamela and Essex Darrell
Current Estimated Value
Home Financials for this Owner
Home Financials are based on the most recent Mortgage that was taken out on this home.
Original Mortgage
$102,920
Outstanding Balance
$82,977
Interest Rate
3.47%
Mortgage Type
New Conventional
Estimated Equity
$137,430
Purchase Details
Closed on
Sep 10, 2015
Sold by
Carpenter Denise
Bought by
Carpenter Denise and Essex Pamela
Purchase Details
Closed on
Sep 12, 1994
Sold by
Cisneros Henry G
Bought by
Mcdaniel Fannie R and Mcdaniel John H
Home Financials for this Owner
Home Financials are based on the most recent Mortgage that was taken out on this home.
Original Mortgage
$59,350
Interest Rate
8.44%
Mortgage Type
VA
Purchase Details
Closed on
Apr 5, 1994
Sold by
Rogers Stanley H and Rogers Sheila B
Bought by
Chemical Mtg Company
Create a Home Valuation Report for This Property
The Home Valuation Report is an in-depth analysis detailing your home's value as well as a comparison with similar homes in the area
Home Values in the Area
Average Home Value in this Area
Purchase History
| Date | Buyer | Sale Price | Title Company |
|---|---|---|---|
| Essex Pamela | -- | -- | |
| Essex Pamela | -- | -- | |
| Carpenter Denise | -- | None Available | |
| Mcdaniel Fannie R | -- | -- | |
| Chemical Mtg Company | $57,000 | -- |
Source: Public Records
Mortgage History
| Date | Status | Borrower | Loan Amount |
|---|---|---|---|
| Open | Essex Pamela | $102,920 | |
| Previous Owner | Mcdaniel Fannie R | $59,350 |
Source: Public Records
Tax History Compared to Growth
Tax History
| Year | Tax Paid | Tax Assessment Tax Assessment Total Assessment is a certain percentage of the fair market value that is determined by local assessors to be the total taxable value of land and additions on the property. | Land | Improvement |
|---|---|---|---|---|
| 2024 | $3,411 | $48,955 | $9,604 | $39,351 |
| 2023 | $3,481 | $48,955 | $9,604 | $39,351 |
| 2022 | $2,534 | $27,857 | $6,202 | $21,655 |
| 2021 | $2,455 | $27,857 | $6,202 | $21,655 |
| 2020 | $2,502 | $27,857 | $6,202 | $21,655 |
| 2019 | $2,505 | $24,651 | $5,488 | $19,163 |
| 2018 | $2,460 | $24,651 | $5,488 | $19,163 |
| 2017 | $2,391 | $24,651 | $5,488 | $19,163 |
| 2016 | $2,959 | $28,518 | $6,097 | $22,421 |
| 2015 | $2,727 | $28,518 | $6,097 | $22,421 |
| 2014 | $2,594 | $28,518 | $6,097 | $22,421 |
| 2013 | $2,619 | $28,518 | $6,097 | $22,421 |
Source: Public Records
Map
Nearby Homes
- 2365 Vera Ave
- 6322 Elbrook Ave
- 6770 Elbrook Ave
- 6314 Hammel Ave
- 2425 Bremont Ave
- 2424 Canterbury Ave
- 6243 Graceland Ave
- 2524 Ardmore Ave
- 6230 Stover Ave
- 2526 Bremont Ave
- 7110 Eastlawn Dr
- 2232 Rosedale Ave
- 2537 Vera Ave
- 7100 Eastlawn Dr
- 2539 Vera Ave
- 7072 Eastlawn Dr
- 2541 Vera Ave
- 2543 Vera Ave
- 6235 Ridgeacres Dr
- 2604 Saint Albans Ave
- 2319 Losantiville Ave
- 2311 Losantiville Ave
- 6467 Mayflower Ave
- 2307 Losantiville Ave
- 6463 Mayflower Ave
- 2305 Losantiville Ave
- 6457 Mayflower Ave
- 6466 Elbrook Ave
- 2318 Losantiville Ave
- 2316 Losantiville Ave
- 2314 Losantiville Ave
- 6466 Mayflower Ave
- 2324 Losantiville Ave
- 2301 Losantiville Ave
- 2310 Losantiville Ave
- 6462 Elbrook Ave
- 6462 Mayflower Ave
- 6455 Mayflower Ave
- 2335 Losantiville Ave
- 2326 Losantiville Ave