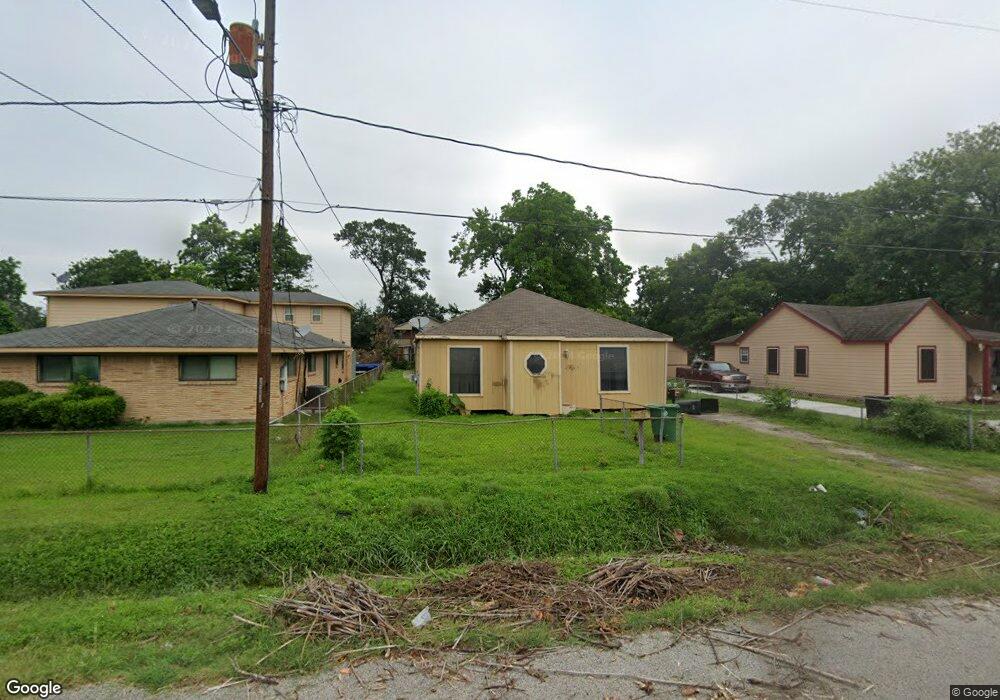
2315 Reid St Houston, TX 77026
Eastex-Jensen NeighborhoodEstimated Value: $187,000 - $275,000
3
Beds
1
Bath
1,518
Sq Ft
$146/Sq Ft
Est. Value
About This Home
This home is located at 2315 Reid St, Houston, TX 77026 and is currently estimated at $220,999, approximately $145 per square foot. 2315 Reid St is a home located in Harris County with nearby schools including Ross Elementary School, Key Middle, and Northside High School.
Ownership History
Date
Name
Owned For
Owner Type
Purchase Details
Closed on
Jan 17, 2022
Sold by
Ann Dike Michelle
Bought by
Thomas Landy
Current Estimated Value
Purchase Details
Closed on
Feb 13, 1996
Sold by
Lagard Rosa Neil and Marks Phyllis Lagard
Bought by
Thomas Renella
Purchase Details
Closed on
Jan 29, 1996
Sold by
Forbes Stephanie
Bought by
Thomas Renella Mae
Purchase Details
Closed on
Nov 7, 1995
Sold by
Mills Rodney B
Bought by
Thomas Marcus W
Create a Home Valuation Report for This Property
The Home Valuation Report is an in-depth analysis detailing your home's value as well as a comparison with similar homes in the area
Home Values in the Area
Average Home Value in this Area
Purchase History
| Date | Buyer | Sale Price | Title Company |
|---|---|---|---|
| Thomas Landy | -- | Childs Law Firm Pc | |
| Thomas Renella | -- | -- | |
| Thomas Renella Mae | -- | -- | |
| Thomas Marcus W | -- | -- |
Source: Public Records
Tax History Compared to Growth
Tax History
| Year | Tax Paid | Tax Assessment Tax Assessment Total Assessment is a certain percentage of the fair market value that is determined by local assessors to be the total taxable value of land and additions on the property. | Land | Improvement |
|---|---|---|---|---|
| 2025 | $3,940 | $175,835 | $78,669 | $97,166 |
| 2024 | $3,940 | $188,309 | $86,344 | $101,965 |
| 2023 | $3,707 | $183,986 | $86,344 | $97,642 |
| 2022 | $3,287 | $149,287 | $57,563 | $91,724 |
| 2021 | $2,949 | $126,551 | $57,563 | $68,988 |
| 2020 | $2,487 | $102,702 | $30,700 | $72,002 |
| 2019 | $1,650 | $102,702 | $30,700 | $72,002 |
| 2018 | $0 | $59,286 | $17,269 | $42,017 |
| 2017 | $1,499 | $59,286 | $17,269 | $42,017 |
| 2016 | $1,499 | $59,286 | $17,269 | $42,017 |
| 2015 | $33 | $55,776 | $15,350 | $40,426 |
| 2014 | $33 | $55,776 | $15,350 | $40,426 |
Source: Public Records
Map
Nearby Homes