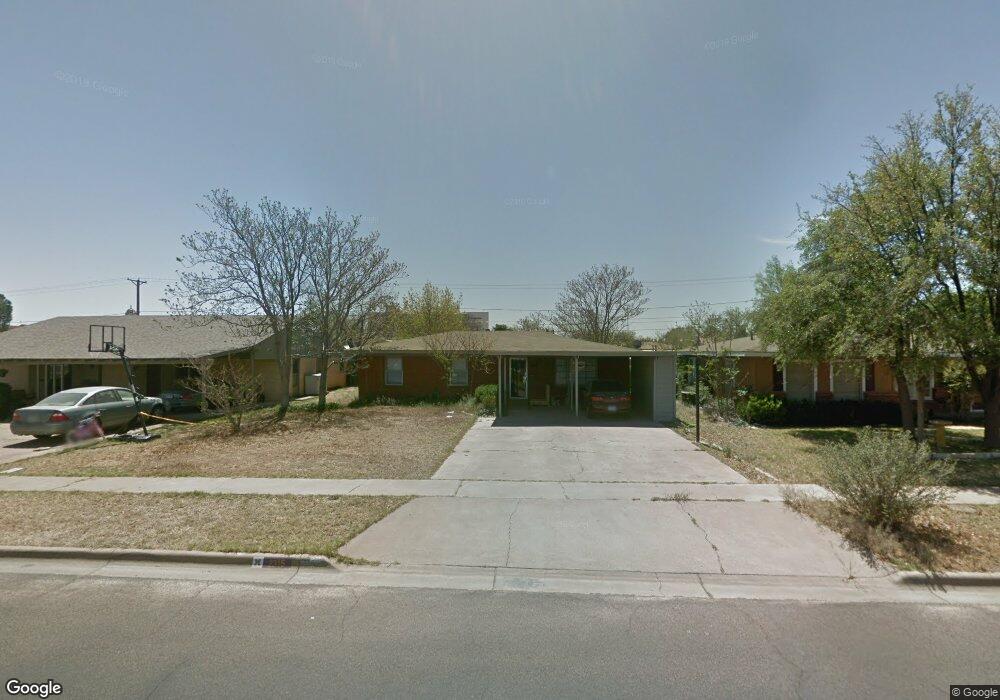
2315 Storey Ave Midland, TX 79701
Estimated Value: $227,838 - $247,000
--
Bed
2
Baths
1,363
Sq Ft
$171/Sq Ft
Est. Value
About This Home
This home is located at 2315 Storey Ave, Midland, TX 79701 and is currently estimated at $233,710, approximately $171 per square foot. 2315 Storey Ave is a home located in Midland County with nearby schools including Midland High School, Sam Houston Collegiate Preparatory Elementary School, and First Baptist Child Development Center.
Ownership History
Date
Name
Owned For
Owner Type
Purchase Details
Closed on
Oct 16, 2025
Sold by
Pulley Wanda Marita
Bought by
Pulley Wanda Marita and Spence Brenda
Current Estimated Value
Purchase Details
Closed on
Oct 6, 2025
Sold by
Pulley Wanda M
Bought by
Pulley Wanda M and Spence Brenda
Purchase Details
Closed on
Nov 15, 2005
Sold by
Grassland Estates West Development Compa
Bought by
Randall L Henson Homes Llc
Home Financials for this Owner
Home Financials are based on the most recent Mortgage that was taken out on this home.
Original Mortgage
$217,080
Interest Rate
5.92%
Mortgage Type
Purchase Money Mortgage
Purchase Details
Closed on
Nov 24, 2004
Bought by
Pulley Wanda
Purchase Details
Closed on
Sep 8, 2004
Sold by
Powell Lloyd Warren
Bought by
Pulley Wanda
Purchase Details
Closed on
Jan 3, 1978
Bought by
Pulley Wanda
Create a Home Valuation Report for This Property
The Home Valuation Report is an in-depth analysis detailing your home's value as well as a comparison with similar homes in the area
Home Values in the Area
Average Home Value in this Area
Purchase History
| Date | Buyer | Sale Price | Title Company |
|---|---|---|---|
| Pulley Wanda Marita | -- | None Listed On Document | |
| Pulley Wanda M | -- | None Listed On Document | |
| Randall L Henson Homes Llc | -- | None Available | |
| Pulley Wanda | -- | -- | |
| Pulley Wanda | -- | -- | |
| Pulley Wanda | -- | -- |
Source: Public Records
Mortgage History
| Date | Status | Borrower | Loan Amount |
|---|---|---|---|
| Previous Owner | Randall L Henson Homes Llc | $217,080 |
Source: Public Records
Tax History Compared to Growth
Tax History
| Year | Tax Paid | Tax Assessment Tax Assessment Total Assessment is a certain percentage of the fair market value that is determined by local assessors to be the total taxable value of land and additions on the property. | Land | Improvement |
|---|---|---|---|---|
| 2025 | $790 | $153,020 | $17,010 | $136,010 |
| 2024 | $793 | $157,280 | $17,010 | $140,270 |
| 2023 | $2,283 | $152,310 | $17,010 | $135,300 |
| 2022 | $2,292 | $146,690 | $17,010 | $129,680 |
| 2021 | $2,350 | $134,900 | $17,010 | $117,890 |
| 2020 | $742 | $137,310 | $17,010 | $120,300 |
| 2019 | $2,600 | $137,310 | $17,010 | $120,300 |
| 2018 | $2,519 | $129,540 | $17,010 | $112,530 |
| 2017 | $2,615 | $134,480 | $17,010 | $117,470 |
| 2016 | $2,466 | $134,620 | $17,010 | $117,610 |
| 2015 | -- | $134,620 | $17,010 | $117,610 |
| 2014 | -- | $132,000 | $17,010 | $114,990 |
Source: Public Records
Map
Nearby Homes
- 1307 W Kansas Ave
- 1208 W Kansas Ave
- 2208 Bedford Dr
- 2009 Bedford Dr
- 2008 Bedford Dr
- 2203 Princeton Ave
- 2610 Storey Ave
- 2001 Country Club Dr
- 1501 Bedford Dr
- 2613 Storey Ave
- 2008 Harvard Ave
- 5921 Zin Valle
- 1422 Lanham St
- 2011 Community Ln
- 1426 Lanham St
- 6716 S County Road 1160 Unit A
- 2003 Community Ln
- 225 E Circle Dr
- 1604 N N St
- 1602 Country Club Dr
- 2313 Storey Ave
- 2317 Storey Ave
- 2311 Storey Ave
- 2319 Storey Ave
- 2314 W Kansas Ave
- 2312 W Kansas Ave
- 2316 W Kansas Ave
- 2309 Storey Ave
- 2314 Storey Ave
- 2310 W Kansas Ave
- 2318 W Kansas Ave
- 2312 Storey Ave
- 2316 Storey Ave
- 2310 Storey Ave
- 2307 Storey Ave
- 2401 Storey Ave
- 2308 W Kansas Ave
- 2308 Storey Ave
- 2305 Storey Ave
- 801 Mogford St