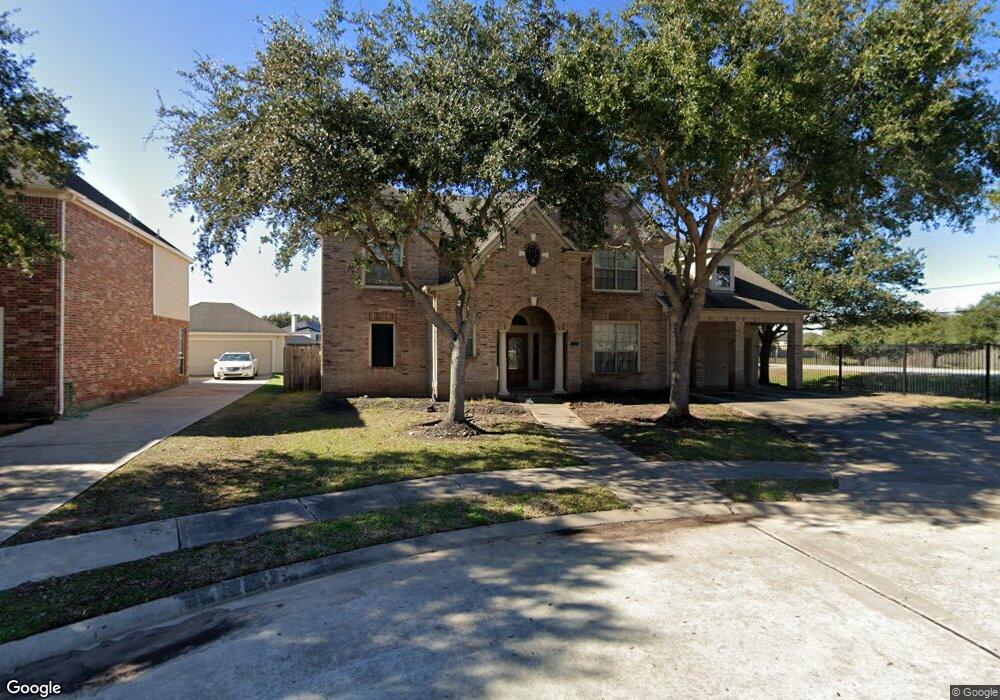
2315 Trinity Manor Ln Richmond, TX 77469
Riverpark NeighborhoodEstimated Value: $483,893 - $564,000
5
Beds
4
Baths
4,411
Sq Ft
$118/Sq Ft
Est. Value
About This Home
This home is located at 2315 Trinity Manor Ln, Richmond, TX 77469 and is currently estimated at $522,473, approximately $118 per square foot. 2315 Trinity Manor Ln is a home located in Fort Bend County with nearby schools including Hutchison Elementary School, J J Wessendorff Middle School, and Lamar Junior High School.
Ownership History
Date
Name
Owned For
Owner Type
Purchase Details
Closed on
Mar 31, 2011
Sold by
Campbell Garrett Distinctive Homes & Est
Bought by
Cheruku Nickell
Current Estimated Value
Home Financials for this Owner
Home Financials are based on the most recent Mortgage that was taken out on this home.
Original Mortgage
$930,000
Outstanding Balance
$648,767
Interest Rate
5.04%
Mortgage Type
Purchase Money Mortgage
Estimated Equity
-$126,294
Purchase Details
Closed on
Jan 18, 2008
Sold by
Perry Homes Llc
Bought by
Komatreddy Swetha
Home Financials for this Owner
Home Financials are based on the most recent Mortgage that was taken out on this home.
Original Mortgage
$277,902
Interest Rate
5.94%
Mortgage Type
Purchase Money Mortgage
Purchase Details
Closed on
Dec 27, 2006
Sold by
J Patrick Homes Inc
Bought by
Komatreddy Swetha
Purchase Details
Closed on
Jun 20, 2006
Sold by
Southwest 545 Lp
Bought by
Komatreddy Swetha
Create a Home Valuation Report for This Property
The Home Valuation Report is an in-depth analysis detailing your home's value as well as a comparison with similar homes in the area
Home Values in the Area
Average Home Value in this Area
Purchase History
| Date | Buyer | Sale Price | Title Company |
|---|---|---|---|
| Cheruku Nickell | -- | Stewart Title Richmond | |
| Komatreddy Swetha | -- | Chicago Title | |
| Komatreddy Swetha | -- | -- | |
| Komatreddy Swetha | -- | -- |
Source: Public Records
Mortgage History
| Date | Status | Borrower | Loan Amount |
|---|---|---|---|
| Open | Cheruku Nickell | $930,000 | |
| Previous Owner | Komatreddy Swetha | $277,902 |
Source: Public Records
Tax History Compared to Growth
Tax History
| Year | Tax Paid | Tax Assessment Tax Assessment Total Assessment is a certain percentage of the fair market value that is determined by local assessors to be the total taxable value of land and additions on the property. | Land | Improvement |
|---|---|---|---|---|
| 2025 | $9,915 | $513,766 | $70,278 | $451,210 |
| 2024 | $9,915 | $467,060 | $17,414 | $449,646 |
| 2023 | $9,047 | $424,600 | $0 | $453,519 |
| 2022 | $9,408 | $386,000 | $0 | $405,680 |
| 2021 | $10,088 | $350,910 | $54,060 | $296,850 |
| 2020 | $10,000 | $344,560 | $54,060 | $290,500 |
| 2019 | $10,269 | $339,570 | $54,060 | $285,510 |
| 2018 | $10,118 | $336,800 | $54,060 | $282,740 |
| 2017 | $9,858 | $330,360 | $54,060 | $276,300 |
| 2016 | $10,071 | $337,490 | $54,060 | $283,430 |
| 2015 | $5,394 | $322,770 | $54,060 | $268,710 |
| 2014 | $5,032 | $293,430 | $54,060 | $239,370 |
Source: Public Records
Map
Nearby Homes
- 21911 Canyonwood Park Ln
- 2143 Ridgefield Park Ln
- 21943 Rustic Canyon Ln
- 21702 Masonwood Ln
- 21903 Grand Brook Ln
- 2414 Hidden Park Ct
- 22107 Skyridge Ln
- 22011 Larchmont Ct
- 8402 Sapphire Sky Ln
- 22114 Winter Sky Ln
- 1918 Mariposa Edge Ln
- 21814 Juniper Wood Ln
- 21818 Juniper Wood Ln
- 2026 Baron Sky Ln
- 22331 Naple Hollow Ln
- 22519 Bassett Hollow Ln
- 22418 Mary Rogers Trail
- 2118 Clyde Falls Dr
- 2007 Clyde Falls Dr
- 2014 Clyde Falls Dr
- 2311 Trinity Manor Ln
- 2307 Trinity Manor Ln
- 2303 Trinity Manor Ln
- 2310 Trinity Manor Ln
- 2314 Trinity Manor Ln
- 2306 Trinity Manor Ln
- 2227 Trinity Manor Ln
- 2338 Barton River Ct
- 2334 Barton River Ct
- 2330 Barton River Ct
- 2223 Trinity Manor Ln
- 21907 Canyonwood Park Ln
- 2342 Barton River Ct
- 2326 Barton River Ct
- 21823 Masonwood Ln
- 2219 Trinity Manor Ln
- 2322 Barton River Ct
- 21903 Canyonwood Park Ln
- 21819 Masonwood Ln
- 21810 Masonwood Ln