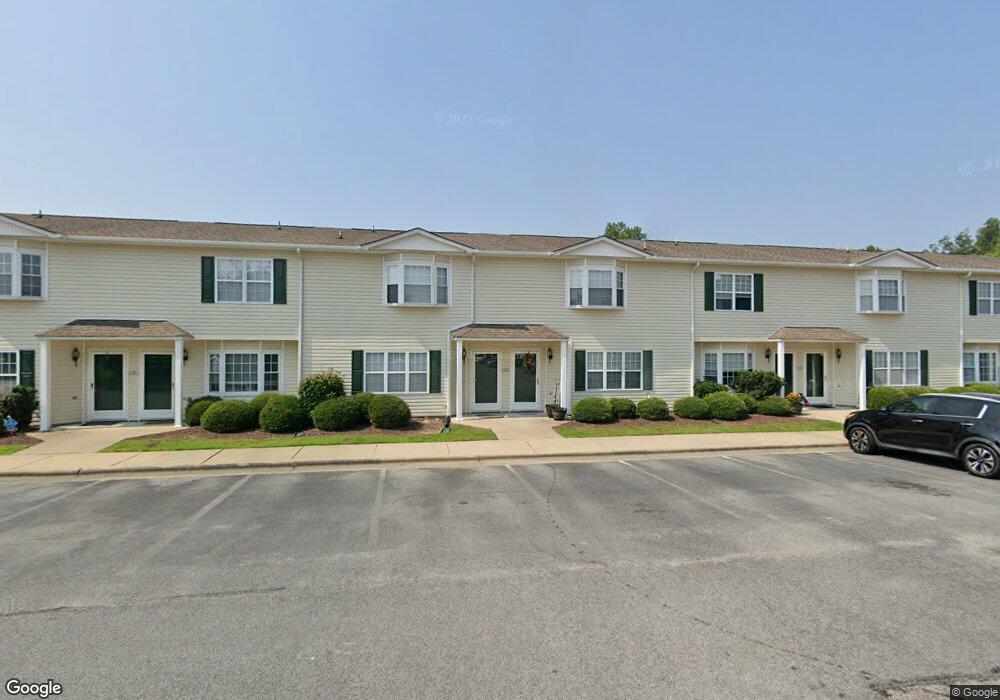
2315 Vineyard Dr Unit 6 Winterville, NC 28590
Estimated Value: $157,000 - $161,000
3
Beds
3
Baths
1,453
Sq Ft
$109/Sq Ft
Est. Value
About This Home
This home is located at 2315 Vineyard Dr Unit 6, Winterville, NC 28590 and is currently estimated at $158,739, approximately $109 per square foot. 2315 Vineyard Dr Unit 6 is a home located in Pitt County with nearby schools including Creekside Elementary School, A.G. Cox Middle School, and South Central High School.
Ownership History
Date
Name
Owned For
Owner Type
Purchase Details
Closed on
May 8, 2015
Sold by
Nugen Stephen Archie and Nugen Julia
Bought by
Staton Amy L
Current Estimated Value
Home Financials for this Owner
Home Financials are based on the most recent Mortgage that was taken out on this home.
Original Mortgage
$77,900
Outstanding Balance
$61,227
Interest Rate
4.25%
Mortgage Type
New Conventional
Estimated Equity
$97,512
Purchase Details
Closed on
Mar 14, 2008
Sold by
Register Ii Raymond F and Register Donna R
Bought by
Nugen Stephen Archie
Purchase Details
Closed on
Jun 9, 2005
Sold by
Vanrack Inc
Bought by
Register Ii Raymond F and Register Donna R
Home Financials for this Owner
Home Financials are based on the most recent Mortgage that was taken out on this home.
Original Mortgage
$59,950
Interest Rate
5.66%
Mortgage Type
New Conventional
Create a Home Valuation Report for This Property
The Home Valuation Report is an in-depth analysis detailing your home's value as well as a comparison with similar homes in the area
Home Values in the Area
Average Home Value in this Area
Purchase History
| Date | Buyer | Sale Price | Title Company |
|---|---|---|---|
| Staton Amy L | $76,000 | Attorney | |
| Nugen Stephen Archie | $87,500 | None Available | |
| Register Ii Raymond F | $76,000 | None Available |
Source: Public Records
Mortgage History
| Date | Status | Borrower | Loan Amount |
|---|---|---|---|
| Open | Staton Amy L | $77,900 | |
| Previous Owner | Register Ii Raymond F | $59,950 |
Source: Public Records
Tax History Compared to Growth
Tax History
| Year | Tax Paid | Tax Assessment Tax Assessment Total Assessment is a certain percentage of the fair market value that is determined by local assessors to be the total taxable value of land and additions on the property. | Land | Improvement |
|---|---|---|---|---|
| 2025 | $1,507 | $141,768 | $15,000 | $126,768 |
| 2024 | $1,495 | $141,768 | $15,000 | $126,768 |
| 2023 | $1,065 | $81,418 | $8,000 | $73,418 |
| 2022 | $1,076 | $81,418 | $8,000 | $73,418 |
| 2021 | $1,065 | $81,418 | $8,000 | $73,418 |
| 2020 | $1,073 | $81,418 | $8,000 | $73,418 |
| 2019 | $1,014 | $75,112 | $8,000 | $67,112 |
| 2018 | $984 | $75,112 | $8,000 | $67,112 |
| 2017 | $984 | $75,112 | $8,000 | $67,112 |
| 2016 | $1,024 | $75,112 | $8,000 | $67,112 |
| 2015 | $1,024 | $79,449 | $8,000 | $71,449 |
| 2014 | $1,024 | $79,449 | $8,000 | $71,449 |
Source: Public Records
Map
Nearby Homes
- 2375 Vineyard Dr Unit H6
- 676 Gatewood Dr
- 2313 Saddleback Dr Unit B
- 2441 Surry Ln
- 1013 Sebring Dr
- 2104 Rhinestone Dr
- 2201 Rhinestone Dr
- 1113 Sebring Dr
- 2601 Rhinestone Dr
- 1124 Sebring Dr
- 1229 Ashmoor Ln
- 1205 Hunley Ct
- 913 Dearborn Ct
- 1217 Hunley Ct
- 1208 Hunley Ct
- 2324 Rhinestone Dr
- Turner Plan at Davenport Farms
- Jordan Plan at Davenport Farms
- Sumner Plan at Davenport Farms
- Bradley Plan at Davenport Farms
- 2315 Vineyard Dr Unit B8
- 2315 Vineyard Dr
- 2315 Vineyard Dr
- 2315 Vineyard Dr
- 2315 Vineyard Dr
- 2315 Vineyard Dr Unit 2
- 2315 Vineyard Dr
- 2315 Vineyard Dr Unit B
- 2315 Vineyard Dr Unit B10
- 2315 Vineyard Dr Unit B6
- 2315 Vineyard Dr Unit B-7
- 2315 Vineyard Dr Unit B4
- 2320 Vineyard Dr
- 2320 Vineyard Dr
- 2320 Vineyard Dr
- 2320 Vineyard Dr
- 2320 Vineyard Dr
- 2320 Vineyard Dr Unit 9
- 2320 Vineyard Dr Unit 5
- 2320 Vineyard Dr Unit 8