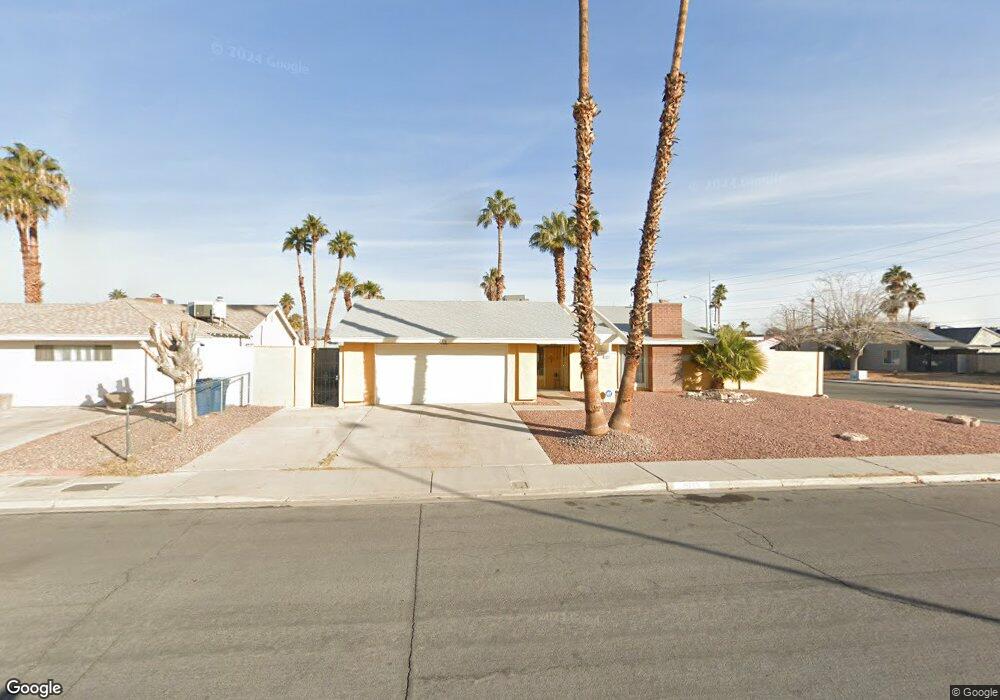
2316 Casey Dr Las Vegas, NV 89119
University District NeighborhoodEstimated Value: $318,000 - $461,000
3
Beds
2
Baths
1,686
Sq Ft
$242/Sq Ft
Est. Value
About This Home
This home is located at 2316 Casey Dr, Las Vegas, NV 89119 and is currently estimated at $407,562, approximately $241 per square foot. 2316 Casey Dr is a home located in Clark County with nearby schools including Jack Dailey Elementary School, Gene Ward Elementary School, and Helen C. Cannon Junior High School.
Ownership History
Date
Name
Owned For
Owner Type
Purchase Details
Closed on
Mar 27, 2009
Sold by
Wells Fargo Bank National Association
Bought by
Magliarditi John
Current Estimated Value
Home Financials for this Owner
Home Financials are based on the most recent Mortgage that was taken out on this home.
Original Mortgage
$98,090
Outstanding Balance
$61,266
Interest Rate
5.04%
Mortgage Type
FHA
Estimated Equity
$346,296
Purchase Details
Closed on
Aug 5, 2008
Sold by
Hernandez Gerardo and Hernandez Flor M
Bought by
Wells Fargo Bank Na and Securitized Asset Backed Receivables Llc
Purchase Details
Closed on
Jun 16, 2005
Sold by
Segreti Anthony Alan
Bought by
Hernandez Gerardo and Hernandez Flor M
Home Financials for this Owner
Home Financials are based on the most recent Mortgage that was taken out on this home.
Original Mortgage
$228,000
Interest Rate
6.27%
Mortgage Type
Unknown
Purchase Details
Closed on
Feb 21, 1997
Sold by
Segreti Anthony and Segreti Theresa
Bought by
Segreti Anthony and Segreti Theresa
Create a Home Valuation Report for This Property
The Home Valuation Report is an in-depth analysis detailing your home's value as well as a comparison with similar homes in the area
Home Values in the Area
Average Home Value in this Area
Purchase History
| Date | Buyer | Sale Price | Title Company |
|---|---|---|---|
| Magliarditi John | $99,900 | First American Title Paseo V | |
| Wells Fargo Bank Na | $195,500 | Lsi Title Agency Inc | |
| Hernandez Gerardo | $285,000 | Lawyers Title Of Nevada | |
| Segreti Anthony | -- | -- |
Source: Public Records
Mortgage History
| Date | Status | Borrower | Loan Amount |
|---|---|---|---|
| Open | Magliarditi John | $98,090 | |
| Previous Owner | Hernandez Gerardo | $228,000 | |
| Closed | Hernandez Gerardo | $57,000 |
Source: Public Records
Tax History
| Year | Tax Paid | Tax Assessment Tax Assessment Total Assessment is a certain percentage of the fair market value that is determined by local assessors to be the total taxable value of land and additions on the property. | Land | Improvement |
|---|---|---|---|---|
| 2026 | $1,340 | $65,611 | $35,000 | $30,611 |
| 2025 | $1,301 | $63,406 | $32,900 | $30,506 |
| 2024 | $1,264 | $63,406 | $32,900 | $30,506 |
| 2023 | $1,264 | $63,213 | $35,700 | $27,513 |
| 2022 | $1,227 | $56,179 | $31,500 | $24,679 |
| 2021 | $1,191 | $49,533 | $26,600 | $22,933 |
| 2020 | $1,154 | $49,514 | $25,900 | $23,614 |
| 2019 | $1,120 | $45,737 | $21,700 | $24,037 |
| 2018 | $1,087 | $44,608 | $20,650 | $23,958 |
| 2017 | $1,227 | $41,841 | $16,800 | $25,041 |
| 2016 | $1,031 | $39,701 | $13,300 | $26,401 |
| 2015 | $1,028 | $37,948 | $11,200 | $26,748 |
| 2014 | $996 | $32,947 | $10,150 | $22,797 |
Source: Public Records
Map
Nearby Homes
- 5064 Jeffreys St Unit 201
- 5086 Jeffreys St Unit 201
- 5353 Percheron St
- 2161 E Hacienda Ave
- 2210 E Reno Ave
- 2454 Paradise Village Way
- 2580 E Hacienda Ave
- 5065 Celebrity Cir
- 5473 S Eastern Ave
- 5473 Clydesdale St
- 5413 Stirrup St
- 1938 Casey Dr
- 5060 Newport Cove Dr Unit C
- 5375 Chestnut St
- 5380 Oxbow St
- 5114 Harrison Dr
- 4910 Newport Cove Dr Unit C
- 4910 Newport Cove Dr Unit D
- 4910 Newport Cove Dr Unit B
- 4910 Newport Cove Dr Unit A
Your Personal Tour Guide
Ask me questions while you tour the home.