2316 Clairborne Cir Santa Rosa, CA 95403
Northwest Santa Rosa NeighborhoodEstimated Value: $720,000 - $767,000
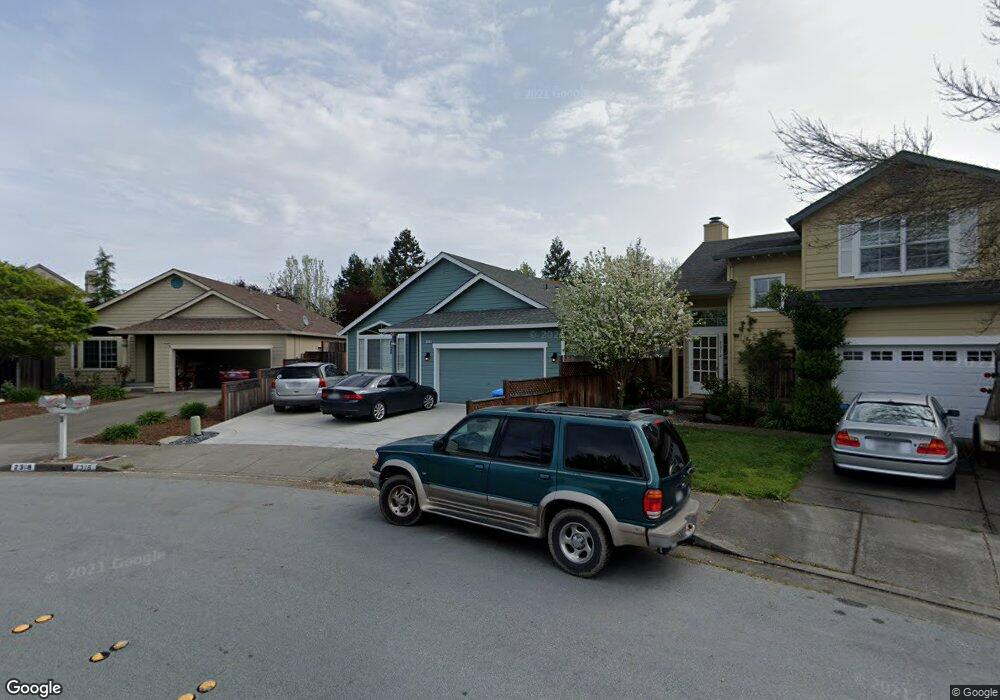
About This Home
This home is located at 2316 Clairborne Cir, Santa Rosa, CA 95403 and is currently estimated at $738,896, approximately $426 per square foot. 2316 Clairborne Cir is a home located in Sonoma County with nearby schools including Jack London Elementary School, Hilliard Comstock Middle School, and Piner High School.
Ownership History
We collect this data history from publicly available records. To have your information removed, we recommend requesting removal directly through your county’s website.
Purchase Details
Home Financials for this Owner
Home Financials are based on the most recent Mortgage that was taken out on this home.Purchase Details
Purchase Details
Home Financials for this Owner
Home Financials are based on the most recent Mortgage that was taken out on this home.Purchase Details
Purchase Details
Home Financials for this Owner
Home Financials are based on the most recent Mortgage that was taken out on this home.Purchase Details
Home Financials for this Owner
Home Financials are based on the most recent Mortgage that was taken out on this home.Purchase Details
Home Financials for this Owner
Home Financials are based on the most recent Mortgage that was taken out on this home.Purchase Details
Home Financials for this Owner
Home Financials are based on the most recent Mortgage that was taken out on this home.Purchase Details
Home Financials for this Owner
Home Financials are based on the most recent Mortgage that was taken out on this home.Home Values in the Area
Average Home Value in this Area
Purchase History
We collect this data history from publicly available records. To have your information removed, we recommend requesting removal directly through your county’s website.
| Date | Buyer | Sale Price | Title Company |
|---|---|---|---|
| $610,000 | North Coast Title Co | ||
| -- | None Available | ||
| $515,000 | Chicago Title Company | ||
| $505,000 | Stewart Title | ||
| -- | Financial Title Company | ||
| -- | Ticor Title Co Of California | ||
| -- | New Century Title Co | ||
| -- | New Century Title Co | ||
| $67,600 | Sonoma Title Guaranty | ||
| -- | Sonoma Title Guaranty | ||
| -- | North American Title Co | ||
| $233,000 | North American Title Co |
Mortgage History
We collect this data history from publicly available records. To have your information removed, we recommend requesting removal directly through your county’s website.
| Date | Status | Borrower | Loan Amount |
|---|---|---|---|
| Open | $280,000 | ||
| Previous Owner | $408,000 | ||
| Previous Owner | $504,000 | ||
| Previous Owner | $200,000 | ||
| Previous Owner | $121,985 | ||
| Previous Owner | $316,200 | ||
| Previous Owner | $209,600 |
Tax History
We collect this data history from publicly available records. To have your information removed, we recommend requesting removal directly through your county’s website.
| Year | Tax Paid | Tax Assessment Tax Assessment Total Assessment is a certain percentage of the fair market value that is determined by local assessors to be the total taxable value of land and additions on the property. | Land | Improvement |
|---|---|---|---|---|
| 2025 | $7,620 | $660,281 | $264,112 | $396,169 |
| 2024 | $7,293 | $647,335 | $258,934 | $388,401 |
| 2023 | $7,293 | $634,643 | $253,857 | $380,786 |
| 2022 | $6,829 | $622,200 | $248,880 | $373,320 |
| 2021 | $7,146 | $610,000 | $244,000 | $366,000 |
| 2020 | $6,636 | $557,342 | $222,980 | $334,362 |
| 2019 | $6,575 | $546,414 | $218,608 | $327,806 |
| 2018 | $6,502 | $535,701 | $214,322 | $321,379 |
| 2017 | $6,317 | $525,198 | $210,120 | $315,078 |
| 2016 | $5,776 | $475,000 | $192,000 | $283,000 |
| 2015 | $3,869 | $331,087 | $106,106 | $224,981 |
| 2014 | $3,724 | $324,602 | $104,028 | $220,574 |
Map
- 2318 Francisco Ave
- 2217 Versaro Dr
- 2390 Battersea St
- 2427 Bramble Way
- 2170 Bock St
- 2295 Francisco Ave Unit 1
- 2453 Northridge Ln
- 2521 Barley Ln
- 2545 Barley Ln
- 2453 Francisco Ave
- 1944 San Salvador Dr
- 2451 Serene Ln
- 2457 Northridge Ln
- 2465 Northridge Ln
- 1945 Piner Rd Unit 173
- 1945 Piner Rd Unit 37
- 2233 Andre Ln
- 2241 Andre Ln
- 3521 Coffey Ln
- 1907 Genoa Place
- 2316 Claiborne Cir
- 2314 Claiborne Cir
- 2318 Claiborne Cir
- 2312 Claiborne Cir
- 2280 Chancery Ct
- 2320 Claiborne Cir
- 2277 Chancery Ct
- 2310 Claiborne Cir
- 2322 Claiborne Cir
- 2321 Claiborne Cir
- 2316 Brompton Ave
- 2276 Chancery Ct
- 2320 Brompton Ave
- 2308 Claiborne Cir
- 2324 Claiborne Cir
- 2324 Brompton Ave
- 2315 Claiborne Cir
- 2273 Chancery Ct
- 2312 Brompton Ave
- 2328 Brompton Ave
Ask me questions while you tour the home.