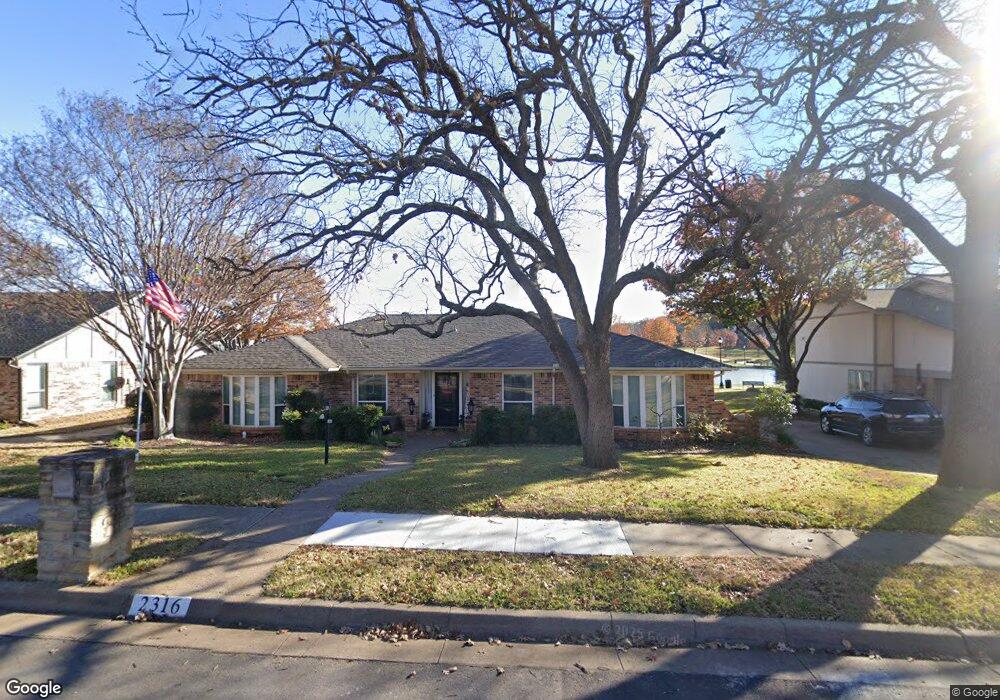
2316 Lakeview Dr Bedford, TX 76021
Estimated Value: $418,881 - $440,000
3
Beds
2
Baths
2,038
Sq Ft
$212/Sq Ft
Est. Value
About This Home
This home is located at 2316 Lakeview Dr, Bedford, TX 76021 and is currently estimated at $431,220, approximately $211 per square foot. 2316 Lakeview Dr is a home located in Tarrant County with nearby schools including Shady Brook Elementary School, Bedford Junior High School, and L.D. Bell High School.
Ownership History
Date
Name
Owned For
Owner Type
Purchase Details
Closed on
Jul 13, 2020
Sold by
Aulerich Dean and Aulerich Donna
Bought by
Aulerich Dean and Aulerich Donna
Current Estimated Value
Purchase Details
Closed on
Feb 28, 2014
Sold by
Lake Victoria Marie
Bought by
Aulerich Dean and Aulerich Donna
Home Financials for this Owner
Home Financials are based on the most recent Mortgage that was taken out on this home.
Original Mortgage
$197,100
Outstanding Balance
$148,137
Interest Rate
4.12%
Mortgage Type
Adjustable Rate Mortgage/ARM
Estimated Equity
$283,083
Purchase Details
Closed on
Aug 18, 2005
Sold by
Shabay Betty Jane
Bought by
Lake Thomas O and Lake Marlene J
Home Financials for this Owner
Home Financials are based on the most recent Mortgage that was taken out on this home.
Original Mortgage
$111,900
Interest Rate
5.61%
Mortgage Type
Fannie Mae Freddie Mac
Create a Home Valuation Report for This Property
The Home Valuation Report is an in-depth analysis detailing your home's value as well as a comparison with similar homes in the area
Home Values in the Area
Average Home Value in this Area
Purchase History
| Date | Buyer | Sale Price | Title Company |
|---|---|---|---|
| Aulerich Dean | -- | None Available | |
| Aulerich Dean | -- | Federal Title | |
| Lake Thomas O | -- | First Land Title |
Source: Public Records
Mortgage History
| Date | Status | Borrower | Loan Amount |
|---|---|---|---|
| Open | Aulerich Dean | $197,100 | |
| Previous Owner | Lake Thomas O | $111,900 |
Source: Public Records
Tax History Compared to Growth
Tax History
| Year | Tax Paid | Tax Assessment Tax Assessment Total Assessment is a certain percentage of the fair market value that is determined by local assessors to be the total taxable value of land and additions on the property. | Land | Improvement |
|---|---|---|---|---|
| 2025 | $5,715 | $332,560 | $100,000 | $232,560 |
| 2024 | $5,715 | $393,347 | $100,000 | $293,347 |
| 2023 | $6,273 | $329,734 | $100,000 | $229,734 |
| 2022 | $6,494 | $321,575 | $100,000 | $221,575 |
| 2021 | $6,367 | $270,300 | $100,000 | $170,300 |
| 2020 | $6,427 | $270,300 | $100,000 | $170,300 |
| 2019 | $6,438 | $265,000 | $108,000 | $157,000 |
| 2018 | $5,748 | $252,332 | $108,000 | $144,332 |
| 2017 | $5,549 | $235,000 | $29,700 | $205,300 |
| 2016 | $5,045 | $208,539 | $29,700 | $178,839 |
| 2015 | $4,432 | $222,846 | $29,700 | $193,146 |
| 2014 | $4,432 | $176,500 | $29,700 | $146,800 |
Source: Public Records
Map
Nearby Homes
- 2317 Shady Grove Dr
- 2501 Shady Grove Dr
- 2508 Lakeview Dr
- 2225 Shady Brook Dr
- 2700 Shady Grove Dr
- 2704 Shady Grove Dr
- 49 Morrow Dr
- 2420 Stonegate Dr N
- 1013 Springdale Rd
- 31 Morrow Dr
- 2503 Shady Ridge Dr
- 2524 Shady Ridge Dr
- 922 Shady Creek Ln
- 18 Park Ln
- 1601 Warwickshire Ct W
- 6 Park Ln
- 2116 Tamworth Ct
- 2436 Brookgreen Ct
- 817 Shady Lake Dr
- 1401 Danielle Dr
- 2320 Lakeview Dr
- 2312 Lakeview Dr
- 2324 Lakeview Dr
- 2317 Lakeview Dr
- 2313 Lakeview Dr
- 2321 Lakeview Dr
- 2309 Lakeview Dr
- 2325 Lakeview Dr
- 2400 Lakeview Dr
- 2316 Shady Grove Dr
- 2305 Lakeview Dr
- 2320 Shady Grove Dr
- 2401 Lakeview Dr
- 2312 Shady Grove Dr
- 2324 Shady Grove Dr
- 2404 Lakeview Dr
- 2301 Lakeview Dr
- 2405 Lakeview Dr
- 2304 Shady Grove Dr
- 2400 Shady Grove Dr