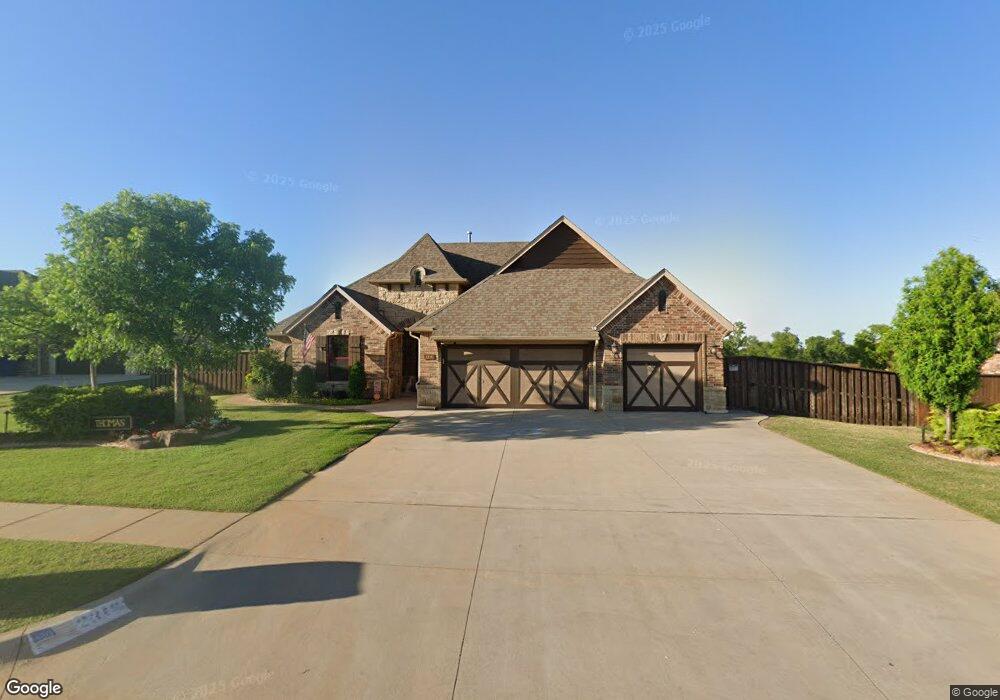
2316 W Beaver Point Dr Mustang, OK 73064
Estimated Value: $365,000 - $439,000
4
Beds
2
Baths
2,184
Sq Ft
$181/Sq Ft
Est. Value
About This Home
This home is located at 2316 W Beaver Point Dr, Mustang, OK 73064 and is currently estimated at $396,291, approximately $181 per square foot. 2316 W Beaver Point Dr is a home with nearby schools including Mustang Lakehoma Elementary School, Mustang Horizon Intermediate School, and Mustang Middle School.
Ownership History
Date
Name
Owned For
Owner Type
Purchase Details
Closed on
Apr 25, 2016
Sold by
Thomas Owen B and Thomas Carol L
Bought by
The Owen B Thomas & Carol L Thomas Revoc
Current Estimated Value
Purchase Details
Closed on
Feb 23, 2016
Sold by
Stone Creek Homes Ltd
Bought by
Thomas Owen B and Thomas Carol L
Home Financials for this Owner
Home Financials are based on the most recent Mortgage that was taken out on this home.
Original Mortgage
$301,119
Outstanding Balance
$239,813
Interest Rate
3.92%
Mortgage Type
VA
Estimated Equity
$156,478
Purchase Details
Closed on
Aug 10, 2015
Sold by
Donald C Anderson Family Phase Ii Llc
Bought by
Stone Creek Homes Ltd
Home Financials for this Owner
Home Financials are based on the most recent Mortgage that was taken out on this home.
Original Mortgage
$255,000
Interest Rate
4.06%
Mortgage Type
Construction
Create a Home Valuation Report for This Property
The Home Valuation Report is an in-depth analysis detailing your home's value as well as a comparison with similar homes in the area
Home Values in the Area
Average Home Value in this Area
Purchase History
| Date | Buyer | Sale Price | Title Company |
|---|---|---|---|
| The Owen B Thomas & Carol L Thomas Revoc | -- | Old Republic Title | |
| Thomas Owen B | $291,500 | Old Republic Title | |
| Stone Creek Homes Ltd | $41,000 | Old Republic Title |
Source: Public Records
Mortgage History
| Date | Status | Borrower | Loan Amount |
|---|---|---|---|
| Open | Thomas Owen B | $301,119 | |
| Previous Owner | Stone Creek Homes Ltd | $255,000 |
Source: Public Records
Tax History Compared to Growth
Tax History
| Year | Tax Paid | Tax Assessment Tax Assessment Total Assessment is a certain percentage of the fair market value that is determined by local assessors to be the total taxable value of land and additions on the property. | Land | Improvement |
|---|---|---|---|---|
| 2024 | $3,580 | $37,989 | $5,160 | $32,829 |
| 2023 | $3,580 | $36,882 | $4,920 | $31,962 |
| 2022 | $3,515 | $35,808 | $4,920 | $30,888 |
| 2021 | $3,423 | $34,765 | $4,920 | $29,845 |
| 2020 | $3,444 | $34,765 | $4,920 | $29,845 |
| 2019 | $3,392 | $34,250 | $4,920 | $29,330 |
| 2018 | $3,362 | $33,252 | $4,920 | $28,332 |
| 2017 | $3,323 | $33,252 | $4,920 | $28,332 |
| 2016 | $60 | $583 | $583 | $0 |
| 2015 | -- | $583 | $583 | $0 |
Source: Public Records
Map
Nearby Homes
- 2224 W Sunset Dr
- 2241 W Mickey Dr
- 2101 W Beaver Point Dr
- 2114 W Cole Dr
- 545 N Fox Way
- 2020 W Flintlock Way
- 1809 W Aqua Clear Dr
- 2012 W Flintlock Way
- 1956 W Flintlock Way
- 1957 W Crossbow Way
- 1907 W Cedar Ridge Dr
- 2001 W Crossbow Way
- 1935 W Flintlock Way
- 1924 W Flintlock Way
- 7201 Country Ln
- 4213 Moonlight Rd
- 4408 Moonlight Rd
- 11617 SW 56th St
- 716 N Cottontail Way
- 4712 Bermuda Dr
- 2240 W Beaver Point Dr
- 2324 W Beaver Point Dr
- 2241 W Beaver Point Dr
- 2317 W Beaver Point Dr
- 2332 W Beaver Point Dr
- 2232 W Beaver Point Dr
- 2233 W Beaver Point Dr
- 2325 W Beaver Point Dr
- 2240 W Earl Dr
- 2316 W Earl Dr
- 2232 W Earl Dr
- 2333 W Beaver Point Dr
- 2324 W Earl Dr
- 2224 W Beaver Point Dr
- 2225 W Beaver Point Dr
- 308 S Chardon Dr
- 300 S Chardon Dr
- 2224 W Earl Dr
- 6205 S Anderson Dr
- 2216 W Beaver Point Dr