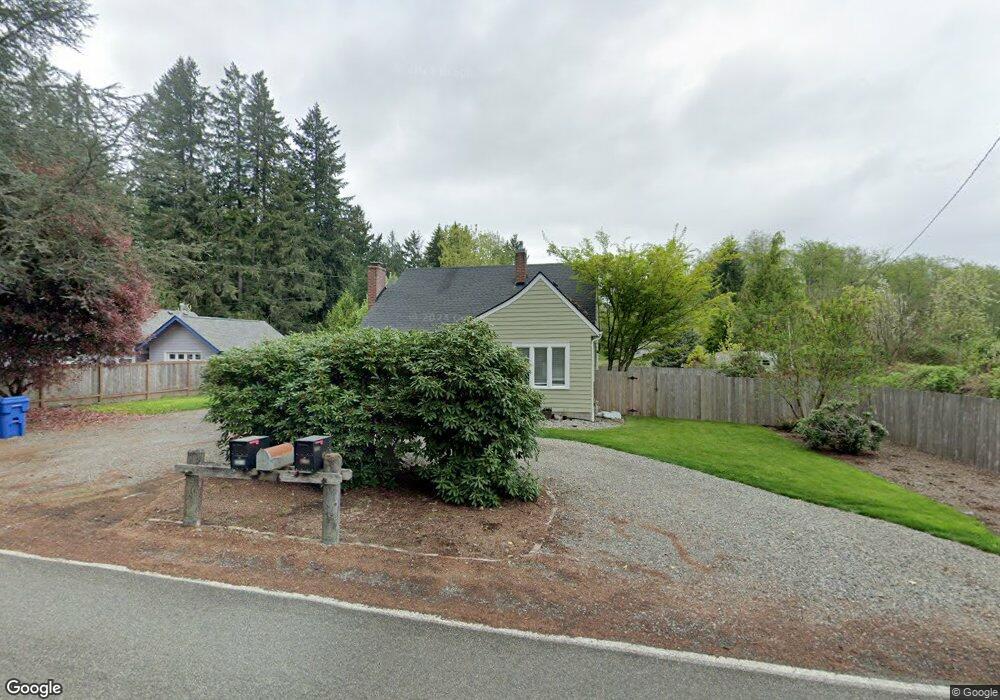
2316 Walnut Rd NW Olympia, WA 98502
Estimated Value: $569,000 - $606,435
3
Beds
2
Baths
1,446
Sq Ft
$408/Sq Ft
Est. Value
About This Home
This home is located at 2316 Walnut Rd NW, Olympia, WA 98502 and is currently estimated at $589,359, approximately $407 per square foot. 2316 Walnut Rd NW is a home located in Thurston County with nearby schools including Leland P. Brown Elementary School, Jefferson Middle School, and Capital High School.
Ownership History
Date
Name
Owned For
Owner Type
Purchase Details
Closed on
Aug 29, 2022
Sold by
Bonds and Kristina
Bought by
C Bonds Properties Llc
Current Estimated Value
Purchase Details
Closed on
May 7, 2020
Sold by
Bonds Bros Inc
Bought by
Bonds Chris
Purchase Details
Closed on
Nov 1, 2017
Sold by
Deutsche Bank National Trust Company
Bought by
Bonds Bros Inc
Purchase Details
Closed on
May 18, 2016
Sold by
Schlottmann Jay E and Baker Deborah
Bought by
Deutsche Bank National Trust Company
Purchase Details
Closed on
Nov 23, 2005
Sold by
Schlottmann Jay F
Bought by
Schlottmann Jay F and Baker Deborah
Home Financials for this Owner
Home Financials are based on the most recent Mortgage that was taken out on this home.
Original Mortgage
$172,500
Interest Rate
9.6%
Mortgage Type
Unknown
Create a Home Valuation Report for This Property
The Home Valuation Report is an in-depth analysis detailing your home's value as well as a comparison with similar homes in the area
Home Values in the Area
Average Home Value in this Area
Purchase History
| Date | Buyer | Sale Price | Title Company |
|---|---|---|---|
| C Bonds Properties Llc | -- | None Listed On Document | |
| Bonds Chris | -- | None Available | |
| Bonds Bros Inc | $163,000 | Chicago Title Company | |
| Deutsche Bank National Trust Company | $250,000 | None Available | |
| Schlottmann Jay F | $32,833 | First American Title |
Source: Public Records
Mortgage History
| Date | Status | Borrower | Loan Amount |
|---|---|---|---|
| Previous Owner | Schlottmann Jay F | $172,500 |
Source: Public Records
Tax History Compared to Growth
Tax History
| Year | Tax Paid | Tax Assessment Tax Assessment Total Assessment is a certain percentage of the fair market value that is determined by local assessors to be the total taxable value of land and additions on the property. | Land | Improvement |
|---|---|---|---|---|
| 2024 | $5,343 | $527,200 | $210,600 | $316,600 |
| 2023 | $5,343 | $510,800 | $184,500 | $326,300 |
| 2022 | $5,066 | $506,300 | $157,300 | $349,000 |
| 2021 | $4,238 | $424,000 | $152,400 | $271,600 |
| 2020 | $2,886 | $328,100 | $133,700 | $194,400 |
| 2019 | $2,504 | $217,800 | $97,100 | $120,700 |
| 2018 | $2,584 | $191,700 | $93,500 | $98,200 |
| 2017 | $2,164 | $172,800 | $100,200 | $72,600 |
| 2016 | $1,838 | $152,600 | $77,300 | $75,300 |
| 2014 | -- | $146,600 | $77,300 | $69,300 |
Source: Public Records
Map
Nearby Homes
- 1022 Cardigan Loop NW
- 2510 17th Ave NW
- 2525 17th Ave NW
- 2012 Dickinson Ave NW
- 2706 Walnut Loop NW
- 1721 Division St NW
- 1810 Thornton St NW
- 2619 Walnut Loop NW
- 1822 Jonquil Ln NW
- 1724 Dickinson Ave NW
- 1720 Dickinson Ave NW
- 1807 Marigold St NW
- 2506 19th Way NW
- 900 Dundee Rd NW
- 812 Dundee Rd NW
- 2005 E End St NW
- 1614 Groves Ave NW
- 1912 Elliott Ave NW
- 2202 Sophie Way NW
- 3121 Langridge Ave NW
- 2348 Walnut Rd NW
- 2354 Walnut Rd NW
- 2304 Walnut Rd NW
- 2315 Walnut Rd NW
- 2345 Walnut Rd NW
- 2220 Walnut Rd NW
- 2310 Walnut Rd NW
- 2303 Walnut Rd NW
- 2219 Walnut Rd NW
- 2210 Walnut Rd NW
- 2409 Walnut Rd NW
- 2351 Walnut Rd NW
- 2211 Walnut Rd NW
- 1229 Bing St NW
- 2416 Walnut Rd NW
- 2521 Walnut Loop NW
- 2114 Walnut Rd NW
- 2523 Walnut Loop NW
- 2420 Walnut Rd NW