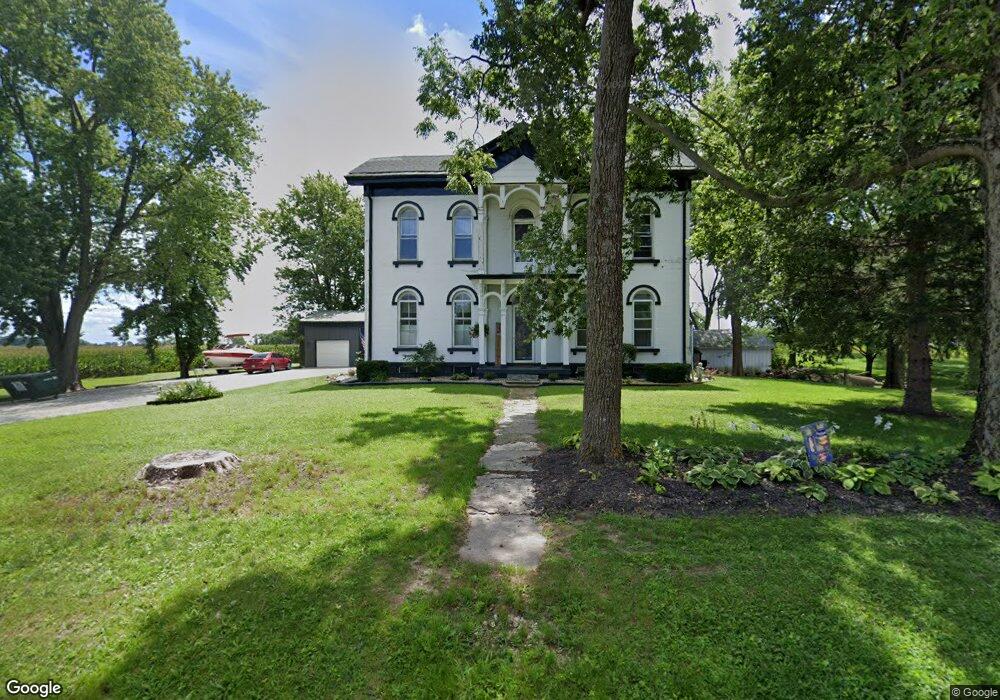
2317 E 200 N Rushville, IN 46173
Estimated Value: $300,000 - $382,000
5
Beds
2
Baths
3,346
Sq Ft
$103/Sq Ft
Est. Value
About This Home
This home is located at 2317 E 200 N, Rushville, IN 46173 and is currently estimated at $345,576, approximately $103 per square foot. 2317 E 200 N is a home located in Rush County with nearby schools including Rushville Consolidated High School.
Ownership History
Date
Name
Owned For
Owner Type
Purchase Details
Closed on
Jan 16, 2007
Sold by
Jones Holly
Bought by
Jones James R and Jones Holly M
Current Estimated Value
Home Financials for this Owner
Home Financials are based on the most recent Mortgage that was taken out on this home.
Original Mortgage
$155,550
Outstanding Balance
$90,724
Interest Rate
6.24%
Mortgage Type
New Conventional
Estimated Equity
$254,852
Purchase Details
Closed on
Jan 12, 2005
Sold by
Chabre Holly and Jones Holly
Bought by
Jones Holly
Create a Home Valuation Report for This Property
The Home Valuation Report is an in-depth analysis detailing your home's value as well as a comparison with similar homes in the area
Purchase History
| Date | Buyer | Sale Price | Title Company |
|---|---|---|---|
| Jones James R | -- | None Available | |
| Jones Holly | -- | None Available |
Source: Public Records
Mortgage History
| Date | Status | Borrower | Loan Amount |
|---|---|---|---|
| Open | Jones James R | $155,550 |
Source: Public Records
Tax History
| Year | Tax Paid | Tax Assessment Tax Assessment Total Assessment is a certain percentage of the fair market value that is determined by local assessors to be the total taxable value of land and additions on the property. | Land | Improvement |
|---|---|---|---|---|
| 2025 | $1,527 | $297,600 | $33,000 | $264,600 |
| 2024 | $1,527 | $257,500 | $33,000 | $224,500 |
| 2023 | $1,580 | $238,200 | $30,600 | $207,600 |
| 2022 | $1,605 | $219,200 | $28,000 | $191,200 |
| 2021 | $1,406 | $187,000 | $24,400 | $162,600 |
| 2020 | $1,341 | $181,200 | $23,000 | $158,200 |
| 2019 | $1,183 | $171,800 | $23,000 | $148,800 |
| 2018 | $1,101 | $167,800 | $23,000 | $144,800 |
| 2017 | $958 | $163,200 | $23,000 | $140,200 |
| 2016 | $883 | $157,800 | $22,200 | $135,600 |
| 2014 | $671 | $154,800 | $22,200 | $132,600 |
| 2013 | $671 | $155,200 | $22,200 | $133,000 |
Source: Public Records
Map
Nearby Homes
Your Personal Tour Guide
Ask me questions while you tour the home.