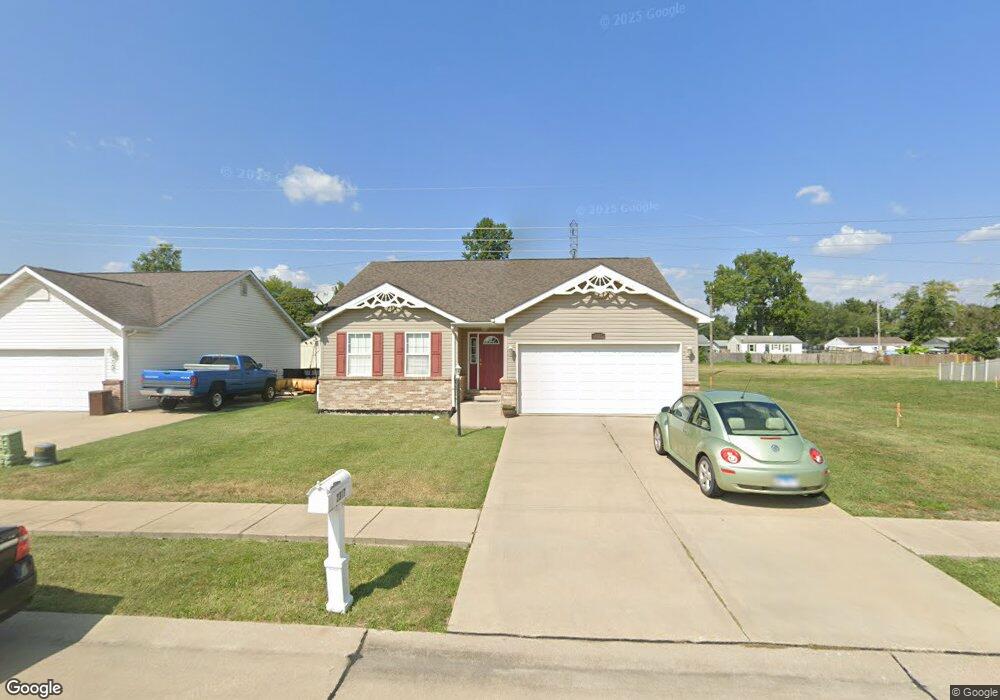
2317 Hunters Point Dr Granite City, IL 62040
Estimated Value: $167,000 - $280,000
3
Beds
2
Baths
1,275
Sq Ft
$165/Sq Ft
Est. Value
About This Home
This home is located at 2317 Hunters Point Dr, Granite City, IL 62040 and is currently estimated at $210,411, approximately $165 per square foot. 2317 Hunters Point Dr is a home located in Madison County with nearby schools including Granite City High School, Rivers of Life Christian School, and Metro East Montessori School.
Ownership History
Date
Name
Owned For
Owner Type
Purchase Details
Closed on
Nov 9, 2010
Sold by
Secretary Of Veterans Affairs
Bought by
Boyer Jackie and Boyer Lana
Current Estimated Value
Home Financials for this Owner
Home Financials are based on the most recent Mortgage that was taken out on this home.
Original Mortgage
$83,120
Outstanding Balance
$54,841
Interest Rate
4.27%
Mortgage Type
New Conventional
Estimated Equity
$155,570
Purchase Details
Closed on
Aug 21, 2010
Sold by
Gabel Chris W and Gabel Theresa
Bought by
The Secretary Of Veterans Affairs
Purchase Details
Closed on
Jan 31, 2007
Sold by
Hunters Point Homes Llc
Bought by
Gabel Chris W and Gabel Deborah
Home Financials for this Owner
Home Financials are based on the most recent Mortgage that was taken out on this home.
Original Mortgage
$161,250
Interest Rate
6.27%
Mortgage Type
VA
Create a Home Valuation Report for This Property
The Home Valuation Report is an in-depth analysis detailing your home's value as well as a comparison with similar homes in the area
Home Values in the Area
Average Home Value in this Area
Purchase History
| Date | Buyer | Sale Price | Title Company |
|---|---|---|---|
| Boyer Jackie | $103,900 | Fatic | |
| The Secretary Of Veterans Affairs | -- | None Available | |
| Gabel Chris W | $158,000 | First American Title Ins Co |
Source: Public Records
Mortgage History
| Date | Status | Borrower | Loan Amount |
|---|---|---|---|
| Open | Boyer Jackie | $83,120 | |
| Previous Owner | Gabel Chris W | $161,250 |
Source: Public Records
Tax History Compared to Growth
Tax History
| Year | Tax Paid | Tax Assessment Tax Assessment Total Assessment is a certain percentage of the fair market value that is determined by local assessors to be the total taxable value of land and additions on the property. | Land | Improvement |
|---|---|---|---|---|
| 2024 | $3,212 | $47,860 | $5,210 | $42,650 |
| 2023 | $3,212 | $43,140 | $4,700 | $38,440 |
| 2022 | $3,061 | $39,530 | $4,310 | $35,220 |
| 2021 | $2,697 | $37,070 | $4,040 | $33,030 |
| 2020 | $2,581 | $35,400 | $3,860 | $31,540 |
| 2019 | $2,445 | $33,560 | $3,660 | $29,900 |
| 2018 | $2,351 | $32,580 | $3,550 | $29,030 |
| 2017 | $2,306 | $33,780 | $3,680 | $30,100 |
| 2016 | $2,394 | $33,780 | $3,680 | $30,100 |
| 2015 | $2,633 | $33,780 | $3,680 | $30,100 |
| 2014 | $2,633 | $33,780 | $3,680 | $30,100 |
| 2013 | $2,633 | $33,780 | $3,680 | $30,100 |
Source: Public Records
Map
Nearby Homes
- 2333 Cardinal Ave
- 2209 Elm Ave
- 2800 Birch Ave
- 2829 Edgewood Ave
- 2817 Maryville Rd
- 2912 Ash Ave
- 2822 Sunset Dr
- 3009 Willow Ave
- 2914 Pershing Blvd
- 2913 Dogwood Dr
- 3040 Dale Ave
- 2465 St Clair
- 2701 Marshall Ave
- 3017 Wayne Ave
- 2922 Marshall Ave
- 3028 Wayne Ave
- 2814 Palmer Ave
- 2821 Edwards St
- 52 Villa Dr
- 3247 Erin Dr
- 2313 Hunters Point Dr
- 2321 Hunters Point Dr
- 2304 Hunters Point Dr
- 2325 Hunters Point Dr
- 2309 Hunters Point Dr
- 2340 Terminal Ave
- 2400 Terminal Ave
- 2305 Hunters Point Dr
- 2404 Terminal Ave
- 2408 Terminal Ave
- 2329 Hunters Point Dr
- 2336 Terminal Ave
- 2301 Hunters Point Dr
- 2248 Wildwood Dr
- 2412 Terminal Ave
- 2332 Terminal Ave
- 2237 Hunters Point Dr
- 2416 Terminal Ave
- 2328 Terminal Ave
- 2345 Terminal Ave