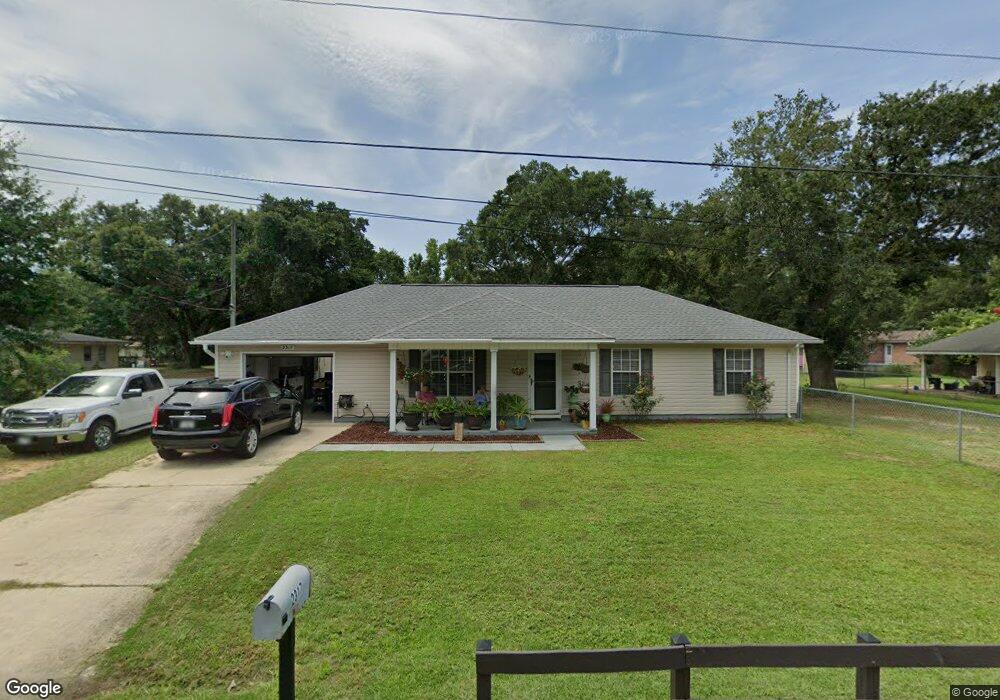
2317 Langston St Pensacola, FL 32514
Estimated Value: $207,000 - $248,000
--
Bed
2
Baths
1,196
Sq Ft
$190/Sq Ft
Est. Value
About This Home
This home is located at 2317 Langston St, Pensacola, FL 32514 and is currently estimated at $227,501, approximately $190 per square foot. 2317 Langston St is a home located in Escambia County with nearby schools including Ferry Pass Elementary School, Ferry Pass Middle School, and Pine Forest High School.
Ownership History
Date
Name
Owned For
Owner Type
Purchase Details
Closed on
Sep 30, 2003
Sold by
Sims Custom Homes Inc
Bought by
Rodriguez Oscar and Rodriguez Sharon L
Current Estimated Value
Home Financials for this Owner
Home Financials are based on the most recent Mortgage that was taken out on this home.
Original Mortgage
$100,425
Outstanding Balance
$47,089
Interest Rate
6.28%
Mortgage Type
VA
Estimated Equity
$180,412
Purchase Details
Closed on
Aug 28, 2003
Sold by
Sims Custom Homes Inc
Bought by
Barnard Marcia A
Home Financials for this Owner
Home Financials are based on the most recent Mortgage that was taken out on this home.
Original Mortgage
$100,425
Outstanding Balance
$47,089
Interest Rate
6.28%
Mortgage Type
VA
Estimated Equity
$180,412
Purchase Details
Closed on
Feb 28, 2003
Sold by
Barnard Marcia C
Bought by
Sims Custom Homes Inc
Home Financials for this Owner
Home Financials are based on the most recent Mortgage that was taken out on this home.
Original Mortgage
$69,600
Interest Rate
5.89%
Create a Home Valuation Report for This Property
The Home Valuation Report is an in-depth analysis detailing your home's value as well as a comparison with similar homes in the area
Home Values in the Area
Average Home Value in this Area
Purchase History
| Date | Buyer | Sale Price | Title Company |
|---|---|---|---|
| Rodriguez Oscar | $97,500 | -- | |
| Barnard Marcia A | -- | -- | |
| Sims Custom Homes Inc | $12,000 | -- |
Source: Public Records
Mortgage History
| Date | Status | Borrower | Loan Amount |
|---|---|---|---|
| Open | Rodriguez Oscar | $100,425 | |
| Previous Owner | Sims Custom Homes Inc | $69,600 |
Source: Public Records
Tax History Compared to Growth
Tax History
| Year | Tax Paid | Tax Assessment Tax Assessment Total Assessment is a certain percentage of the fair market value that is determined by local assessors to be the total taxable value of land and additions on the property. | Land | Improvement |
|---|---|---|---|---|
| 2024 | $816 | $95,182 | -- | -- |
| 2023 | $816 | $92,410 | $0 | $0 |
| 2022 | $789 | $89,719 | $0 | $0 |
| 2021 | $781 | $87,106 | $0 | $0 |
| 2020 | $763 | $85,904 | $0 | $0 |
| 2019 | $743 | $83,973 | $0 | $0 |
| 2018 | $738 | $82,408 | $0 | $0 |
| 2017 | $731 | $80,714 | $0 | $0 |
| 2016 | $721 | $79,054 | $0 | $0 |
| 2015 | $700 | $78,505 | $0 | $0 |
| 2014 | $687 | $77,882 | $0 | $0 |
Source: Public Records
Map
Nearby Homes
- 2360 Shoal Creek Dr
- 2354 Shoal Creek Dr
- 2308 Shoal Creek Dr
- 2393 Shoal Creek Dr
- 2300 BLK Gloria Cir
- 139 Mirabelle Cir
- 345 Mirabelle Dr
- 9400 Mabel St
- 2719 Copter Rd
- 364 Mirabelle Dr
- 8573 Westview Ln
- 2371 Le Ruth Dr
- 9021 University Pkwy
- 8511 Sawmill Run
- 8560 Westview Ln
- 9000 Governors Place Ct Unit Lot 10
- 9000 Governors Place Ct Unit Lot 4
- 9000 Governors Place Ct Unit Lot 7
- 9000 Governors Place Ct Unit Lot 5
- 9000 Governors Place Ct Unit Lot 8
- 2311 Langston St
- 2306 Lacey Cir
- 2302 Lacey Cir
- 2309 Langston St
- 2323 Langston St
- 2341 Langston St
- 0 Langston St
- 2345 Langston St
- 2328 Lacey Cir
- 2210 Lacey Cir
- 2339 Langston St
- 2265 Langston St
- 2208 Lacey Cir
- 2343 Langston St
- 2330 Lacey Cir
- 2319 Lacey Cir
- 2327 Lacey Cir
- 2255 Langston St
- 2347 Langston St
- 2329 Lacey Cir