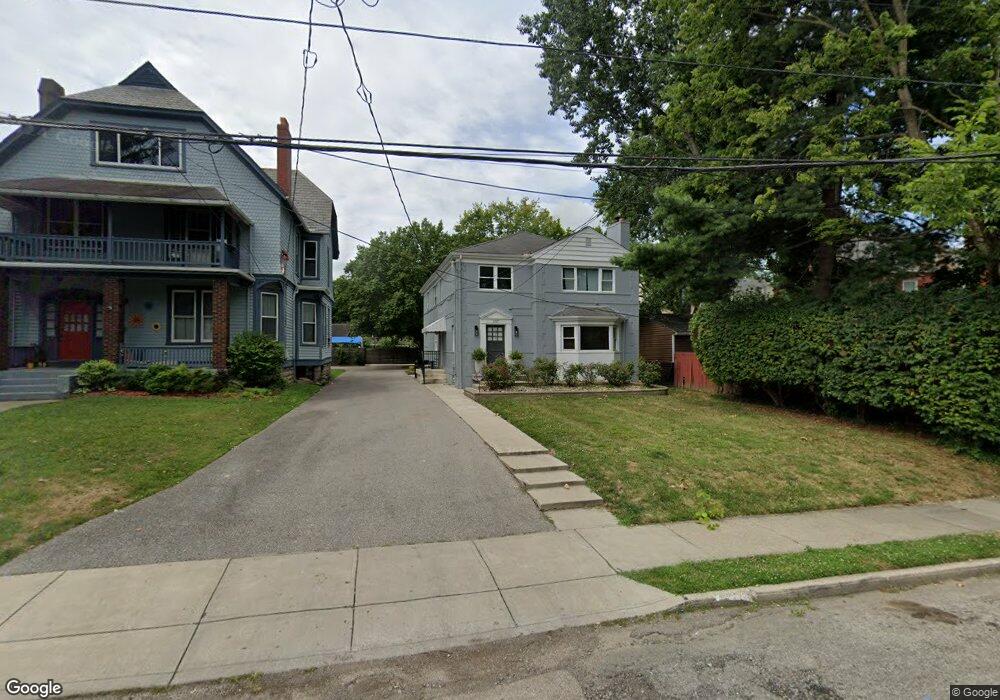
2317 Monroe Ave Cincinnati, OH 45212
Estimated Value: $332,354 - $572,000
Studio
--
Bath
--
Sq Ft
9,801
Sq Ft
About This Home
This home is located at 2317 Monroe Ave, Cincinnati, OH 45212 and is currently estimated at $452,177. 2317 Monroe Ave is a home located in Hamilton County with nearby schools including Norwood High School, Cornerstone Christian Academy, and Immaculate Conception Academy.
Ownership History
Date
Name
Owned For
Owner Type
Purchase Details
Closed on
Sep 24, 2021
Sold by
Gunning Patrick M
Bought by
2317 Monroe Llc
Current Estimated Value
Purchase Details
Closed on
Jul 13, 2021
Sold by
2317 Monroe Llc
Bought by
Gunning Patrick M
Purchase Details
Closed on
Oct 31, 2019
Sold by
Keller Eric M and Keller Janet Ellen
Bought by
2317 Monroe Llc
Home Financials for this Owner
Home Financials are based on the most recent Mortgage that was taken out on this home.
Original Mortgage
$260,108
Interest Rate
3.7%
Mortgage Type
Commercial
Purchase Details
Closed on
Mar 27, 2006
Sold by
Presidential District Properties Llc
Bought by
Keller Eric M
Home Financials for this Owner
Home Financials are based on the most recent Mortgage that was taken out on this home.
Original Mortgage
$174,800
Interest Rate
6.33%
Mortgage Type
Unknown
Purchase Details
Closed on
Dec 8, 2004
Sold by
Giolando Salvatore T
Bought by
Presidential District Properties Llc
Create a Home Valuation Report for This Property
The Home Valuation Report is an in-depth analysis detailing your home's value as well as a comparison with similar homes in the area
Home Values in the Area
Average Home Value in this Area
Purchase History
| Date | Buyer | Sale Price | Title Company |
|---|---|---|---|
| 2317 Monroe Llc | -- | Yonas & Phillabaum Llc | |
| Gunning Patrick M | -- | None Available | |
| 2317 Monroe Llc | $300,000 | None Available | |
| Keller Eric M | $218,500 | None Available | |
| Presidential District Properties Llc | -- | Lighthouse Title Services |
Source: Public Records
Mortgage History
| Date | Status | Borrower | Loan Amount |
|---|---|---|---|
| Previous Owner | 2317 Monroe Llc | $260,108 | |
| Previous Owner | Keller Eric M | $174,800 |
Source: Public Records
Tax History
| Year | Tax Paid | Tax Assessment Tax Assessment Total Assessment is a certain percentage of the fair market value that is determined by local assessors to be the total taxable value of land and additions on the property. | Land | Improvement |
|---|---|---|---|---|
| 2025 | $1,240 | $23,356 | $7,917 | $15,439 |
| 2024 | $1,241 | $23,356 | $7,917 | $15,439 |
| 2023 | $1,248 | $23,356 | $7,917 | $15,439 |
| 2022 | $919 | $14,497 | $1,498 | $12,999 |
| 2021 | $915 | $14,497 | $1,498 | $12,999 |
| 2020 | $895 | $14,497 | $1,498 | $12,999 |
| 2019 | $850 | $12,716 | $1,313 | $11,403 |
| 2018 | $851 | $12,716 | $1,313 | $11,403 |
| 2017 | $812 | $12,716 | $1,313 | $11,403 |
| 2016 | $88 | $1,313 | $1,313 | $0 |
| 2015 | $78 | $1,313 | $1,313 | $0 |
| 2014 | $77 | $1,313 | $1,313 | $0 |
| 2013 | $76 | $1,313 | $1,313 | $0 |
Source: Public Records
Map
Nearby Homes
- 2241 Cameron Ave
- 4026 Burwood Ave
- 3931 Burwood Ave
- 2223 Madison Ave
- 2557 Shanmoor Ave
- 3950 Elsmere Ave
- 4010 S Jefferson Ave
- 3929 Hazel Ave
- 4206 Lafayette Ave
- 3933 Grove Ave
- 4108 Montgomery Rd
- 4317 Smith Rd
- 2010 Hopkins Ave
- 4308 Smith Rd
- 3766 Floral Ave
- 2604 Melrose Ave
- 1931 Waverly Ave
- 2043 Lawrence Ave
- 2620 Melrose Ave
- 3764 Grovedale Place
- 2317 Monroe Ave
- 2317 Monroe Ave Unit 1
- 2319 Monroe Ave
- 4146 Floral Ave
- 4142 Floral Ave
- 4150 Floral Ave
- 4140 Floral Ave
- 4136 Floral Ave
- 4121 Forest Ave
- 4121 Forest Ave Unit THIRTY
- 4127 Forest Ave
- 4127 Forest Ave Unit 30
- 2314 Monroe Ave
- 2316 Monroe Ave
- 4132 Floral Ave
- 4119 Forest Ave
- 4119 Forest Ave Unit 30
- 2320 Monroe Ave
- 4204 Floral Ave
- 4124 Floral Ave
Your Personal Tour Guide
Ask me questions while you tour the home.