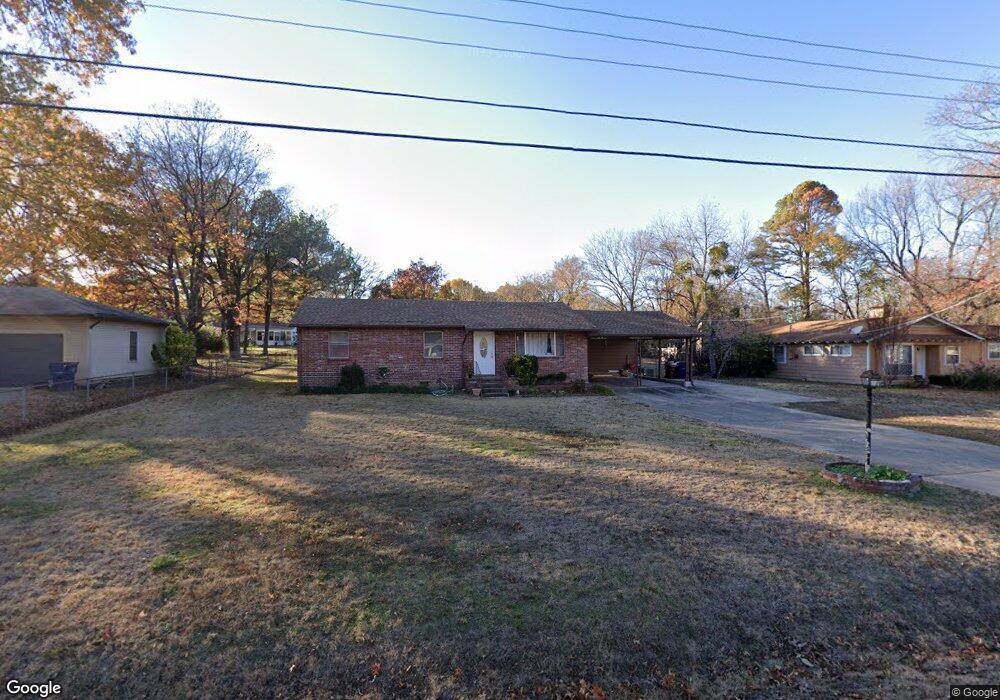
2317 N 53rd St Fort Smith, AR 72904
Estimated Value: $141,450 - $181,000
--
Bed
3
Baths
1,490
Sq Ft
$108/Sq Ft
Est. Value
About This Home
This home is located at 2317 N 53rd St, Fort Smith, AR 72904 and is currently estimated at $161,363, approximately $108 per square foot. 2317 N 53rd St is a home located in Sebastian County with nearby schools including Sutton Elementary School, Dora Kimmons Junior High School, and Northside High School.
Ownership History
Date
Name
Owned For
Owner Type
Purchase Details
Closed on
Dec 14, 2007
Sold by
Rajsombath Nary and Rajsombath Panh B
Bought by
Rajsombath Panh B and Rajsombath Nary
Current Estimated Value
Home Financials for this Owner
Home Financials are based on the most recent Mortgage that was taken out on this home.
Original Mortgage
$50,000
Interest Rate
6.26%
Mortgage Type
New Conventional
Purchase Details
Closed on
Nov 7, 2007
Sold by
Rajsombath Thongkhanh and Chareundy Vorachit
Bought by
Rajsombath Nary
Home Financials for this Owner
Home Financials are based on the most recent Mortgage that was taken out on this home.
Original Mortgage
$50,000
Interest Rate
6.26%
Mortgage Type
New Conventional
Purchase Details
Closed on
Jul 2, 1993
Bought by
Rajsombath Mary and Rajsombath Thongkhanh
Purchase Details
Closed on
Jul 25, 1979
Bought by
Novick Patricia L
Create a Home Valuation Report for This Property
The Home Valuation Report is an in-depth analysis detailing your home's value as well as a comparison with similar homes in the area
Home Values in the Area
Average Home Value in this Area
Purchase History
| Date | Buyer | Sale Price | Title Company |
|---|---|---|---|
| Rajsombath Panh B | -- | Mosley Abstract & Title Insu | |
| Rajsombath Nary | -- | Mosley Abstract & Title Insu | |
| Rajsombath Mary | -- | -- | |
| Novick Patricia L | $42,000 | -- |
Source: Public Records
Mortgage History
| Date | Status | Borrower | Loan Amount |
|---|---|---|---|
| Closed | Rajsombath Panh B | $50,000 |
Source: Public Records
Tax History Compared to Growth
Tax History
| Year | Tax Paid | Tax Assessment Tax Assessment Total Assessment is a certain percentage of the fair market value that is determined by local assessors to be the total taxable value of land and additions on the property. | Land | Improvement |
|---|---|---|---|---|
| 2024 | $757 | $16,500 | $2,400 | $14,100 |
| 2023 | $412 | $16,500 | $2,400 | $14,100 |
| 2022 | $462 | $16,500 | $2,400 | $14,100 |
| 2021 | $462 | $16,500 | $2,400 | $14,100 |
| 2020 | $462 | $16,500 | $2,400 | $14,100 |
| 2019 | $462 | $14,410 | $2,000 | $12,410 |
| 2018 | $487 | $14,410 | $2,000 | $12,410 |
| 2017 | $407 | $14,410 | $2,000 | $12,410 |
| 2016 | $757 | $14,410 | $2,000 | $12,410 |
| 2015 | $757 | $14,410 | $2,000 | $12,410 |
| 2014 | $448 | $15,200 | $2,800 | $12,400 |
Source: Public Records
Map
Nearby Homes
- 1125 N 52nd St
- 2206 N 53rd St
- 2119 N 55th Place
- 5301 Kelley Hwy
- 2001 N 55th Place
- 2615 N 50th St
- 5020 Wirsing Ave
- 1906 N 52nd St
- 1920 N 50th St
- 4705 Johnson St
- 4509 Urbana Dr
- 1906 N 47th St
- 4415 Urbana Dr
- 5200 N O St
- 1800 N 45th Terrace
- 3409 N 49th St
- 4727 N N St
- 3404 N 47th St
- 4322 Royal Oak Dr
- 1326 N 56th Terrace