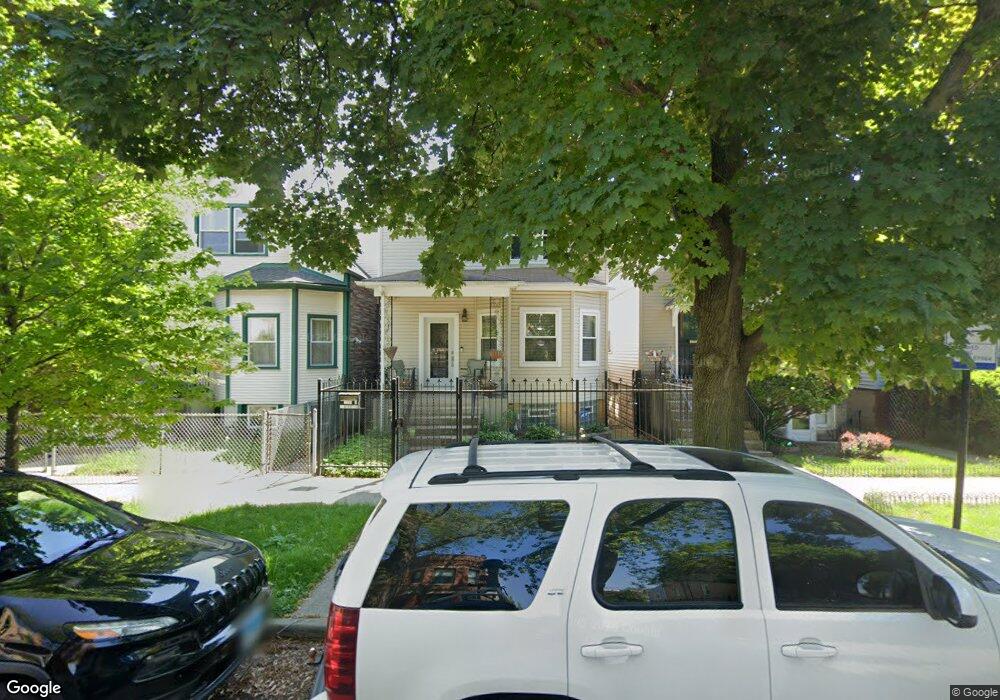
2317 N Spaulding Ave Chicago, IL 60647
Logan Square NeighborhoodEstimated Value: $582,000 - $907,450
4
Beds
2
Baths
1,928
Sq Ft
$385/Sq Ft
Est. Value
About This Home
This home is located at 2317 N Spaulding Ave, Chicago, IL 60647 and is currently estimated at $742,613, approximately $385 per square foot. 2317 N Spaulding Ave is a home located in Cook County with nearby schools including Darwin Elementary School, Clemente Community Academy High School, and St. Sylvester School.
Ownership History
Date
Name
Owned For
Owner Type
Purchase Details
Closed on
Aug 16, 2004
Sold by
Chicago Title Land Trust Co
Bought by
Feliciano Ruben and Feliciano Reina E
Current Estimated Value
Home Financials for this Owner
Home Financials are based on the most recent Mortgage that was taken out on this home.
Original Mortgage
$255,000
Outstanding Balance
$124,581
Interest Rate
6.1%
Mortgage Type
Stand Alone First
Estimated Equity
$618,032
Purchase Details
Closed on
Jun 11, 2002
Sold by
Hud
Bought by
Chicago Title Land Co Trust #1108868
Purchase Details
Closed on
Feb 16, 2001
Sold by
Harrington Scott D
Bought by
Hud
Purchase Details
Closed on
Apr 24, 1998
Sold by
Minnick Catherine J and Monreal Catherine M
Bought by
Harrington Scott D
Home Financials for this Owner
Home Financials are based on the most recent Mortgage that was taken out on this home.
Original Mortgage
$120,808
Interest Rate
7.26%
Mortgage Type
FHA
Create a Home Valuation Report for This Property
The Home Valuation Report is an in-depth analysis detailing your home's value as well as a comparison with similar homes in the area
Home Values in the Area
Average Home Value in this Area
Purchase History
| Date | Buyer | Sale Price | Title Company |
|---|---|---|---|
| Feliciano Ruben | $340,000 | Stewart Title Of Illinois | |
| Chicago Title Land Co Trust #1108868 | -- | Stewart Title Of Illinois | |
| Hud | -- | -- | |
| Harrington Scott D | $122,000 | -- |
Source: Public Records
Mortgage History
| Date | Status | Borrower | Loan Amount |
|---|---|---|---|
| Open | Feliciano Ruben | $255,000 | |
| Previous Owner | Harrington Scott D | $120,808 |
Source: Public Records
Tax History
| Year | Tax Paid | Tax Assessment Tax Assessment Total Assessment is a certain percentage of the fair market value that is determined by local assessors to be the total taxable value of land and additions on the property. | Land | Improvement |
|---|---|---|---|---|
| 2025 | $13,965 | $58,283 | $12,858 | $45,425 |
| 2024 | $13,965 | $58,283 | $12,858 | $45,425 |
| 2023 | $15,186 | $69,270 | $10,425 | $58,845 |
| 2022 | $15,186 | $77,000 | $10,425 | $66,575 |
| 2021 | $14,864 | $77,003 | $10,428 | $66,575 |
| 2020 | $8,334 | $40,380 | $5,038 | $35,342 |
| 2019 | $8,457 | $45,371 | $5,038 | $40,333 |
| 2018 | $9,336 | $50,700 | $5,038 | $45,662 |
| 2017 | $5,094 | $27,040 | $4,517 | $22,523 |
| 2016 | $4,916 | $27,040 | $4,517 | $22,523 |
| 2015 | $4,474 | $27,040 | $4,517 | $22,523 |
| 2014 | $4,508 | $26,866 | $4,170 | $22,696 |
| 2013 | $4,408 | $26,866 | $4,170 | $22,696 |
Source: Public Records
Map
Nearby Homes
- 2038.5 N Spaulding Ave Unit 1W
- 2210 N Kedzie Blvd Unit 1N
- 3432 W Belden Ave Unit 1
- 2148 N Sawyer Ave Unit 202
- 2454 N Spaulding Ave
- 2429 N Drake Ave
- 3041 W Fullerton Ave
- 2065 N Kedzie Ave Unit 328
- 2444 N Linden Place Unit 1
- 3412 W Mclean Ave
- 3017 W Fullerton Ave
- 3018 W Lyndale St Unit 2
- 3024 W Palmer Blvd Unit 1S
- 2606 N Kedzie Ave
- 3009 W Belden Ave
- 2228 N Central Park Ave
- 2323 N Monticello Ave
- 2503 N Milwaukee Ave Unit 2N
- 2450 N Central Park Ave
- 2491 N Milwaukee Ave Unit 4S
- 2321 N Spaulding Ave
- 2315 N Spaulding Ave
- 2313 N Spaulding Ave
- 2323 N Spaulding Ave
- 2323 N Spaulding Ave Unit 1
- 2311 N Spaulding Ave
- 2325 N Spaulding Ave
- 2327 N Spaulding Ave
- 2327 N Spaulding Ave Unit 1
- 2327 N Spaulding Ave Unit 2334-1A
- 2327 N Spaulding Ave Unit 3A
- 2327 N Spaulding Ave Unit 2338-1B
- 2327 N Spaulding Ave Unit 1A
- 2327 N Spaulding Ave Unit 2330
- 2307 N Spaulding Ave
- 2307 N Spaulding Ave Unit 2
- 2307 N Spaulding Ave Unit 3
- 2307 N Spaulding Ave Unit 1
- 2331 N Spaulding Ave
- 2331 N Spaulding Ave Unit 2
Your Personal Tour Guide
Ask me questions while you tour the home.