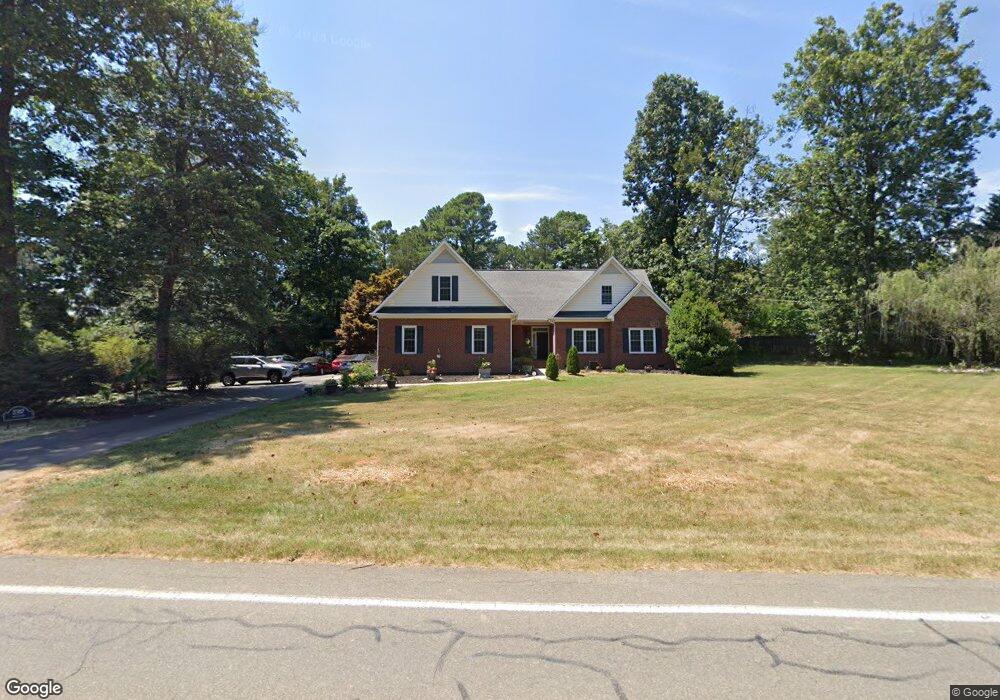
2317 Orange Grove Rd Hillsborough, NC 27278
Estimated Value: $683,870 - $772,000
4
Beds
3
Baths
3,360
Sq Ft
$216/Sq Ft
Est. Value
About This Home
This home is located at 2317 Orange Grove Rd, Hillsborough, NC 27278 and is currently estimated at $726,468, approximately $216 per square foot. 2317 Orange Grove Rd is a home located in Orange County with nearby schools including Grady Brown Elementary School, A.L. Stanback Middle School, and Cedar Ridge High.
Ownership History
Date
Name
Owned For
Owner Type
Purchase Details
Closed on
May 13, 2020
Sold by
Burton Charles and Burton Ann
Bought by
Orozco Georgetty Julianne Orozco and Cinto Selvyn Otoniel
Current Estimated Value
Home Financials for this Owner
Home Financials are based on the most recent Mortgage that was taken out on this home.
Original Mortgage
$398,050
Outstanding Balance
$352,728
Interest Rate
3.3%
Mortgage Type
New Conventional
Estimated Equity
$373,740
Purchase Details
Closed on
Oct 19, 2018
Sold by
Cecil J D and Cecil Sonya C
Bought by
Fulford Karen B and Burton Charles M
Home Financials for this Owner
Home Financials are based on the most recent Mortgage that was taken out on this home.
Original Mortgage
$318,477
Interest Rate
4.5%
Mortgage Type
FHA
Purchase Details
Closed on
Nov 10, 2003
Sold by
Cecil Myrtle L and Cecil Louise M
Bought by
Cecil J D
Create a Home Valuation Report for This Property
The Home Valuation Report is an in-depth analysis detailing your home's value as well as a comparison with similar homes in the area
Home Values in the Area
Average Home Value in this Area
Purchase History
| Date | Buyer | Sale Price | Title Company |
|---|---|---|---|
| Orozco Georgetty Julianne Orozco | $419,000 | None Available | |
| Fulford Karen B | $325,000 | First American Mortgage Solu | |
| Cecil J D | -- | -- |
Source: Public Records
Mortgage History
| Date | Status | Borrower | Loan Amount |
|---|---|---|---|
| Open | Orozco Georgetty Julianne Orozco | $398,050 | |
| Previous Owner | Fulford Karen B | $318,477 |
Source: Public Records
Tax History Compared to Growth
Tax History
| Year | Tax Paid | Tax Assessment Tax Assessment Total Assessment is a certain percentage of the fair market value that is determined by local assessors to be the total taxable value of land and additions on the property. | Land | Improvement |
|---|---|---|---|---|
| 2025 | $4,489 | $595,700 | $63,100 | $532,600 |
| 2024 | $4,358 | $431,600 | $43,800 | $387,800 |
| 2023 | $4,200 | $431,600 | $43,800 | $387,800 |
| 2022 | $4,139 | $431,600 | $43,800 | $387,800 |
| 2021 | $4,085 | $431,600 | $43,800 | $387,800 |
| 2020 | $3,977 | $398,400 | $37,500 | $360,900 |
| 2018 | $3,885 | $398,400 | $37,500 | $360,900 |
| 2017 | $3,821 | $398,400 | $37,500 | $360,900 |
| 2016 | $3,821 | $386,200 | $38,200 | $348,000 |
| 2015 | $3,821 | $386,200 | $38,200 | $348,000 |
| 2014 | $3,762 | $386,200 | $38,200 | $348,000 |
Source: Public Records
Map
Nearby Homes
- 675 Oakdale Dr
- 2304 Hardwood Dr
- 2310 Hardwood Dr
- 2118 Magnolia Ln
- 2601 Myrtle Ln
- 1831 Birmingham Dr
- 309 Spicebush Cir
- 2300 Red Oak Ct
- 1021 Dimmocks Mill Rd
- 1812 Orange Grove Rd Unit 101
- 2705 Brick Hearth Dr
- 1455 Dimmocks Mill Rd
- 1800 Orange Grove Rd
- 3901 Old Nc 86
- 1704 Orange Grove Rd
- 1600 Orange Grove Rd
- 00 Ode Turner Rd
- 106 Twisted Ct
- 301 W Hill Ave S
- 2201 Moorefields Rd
- 2316 Orange Grove Rd
- 219 Romero Grove Ln
- 2322 Orange Grove Rd
- 2323 Orange Grove Rd
- 2310 Orange Grove Rd
- 2303 Hedgepath Ln
- 223 Romero Grove Ln
- 999 Timbers Dr
- 216 Romero Grove Ln
- 2302 Orange Grove Rd
- 923 Oakdale Dr
- 2218 Orange Grove Rd
- Lot #2 Timbers Dr
- 2210 Orange Grove Rd
- 2209 Orange Grove Rd
- 2326 Orange Grove Rd
- 2206 Orange Grove Rd
- 2330 Orange Grove Rd
- 2204 Orange Grove Rd
- 2200 Orange Grove Rd