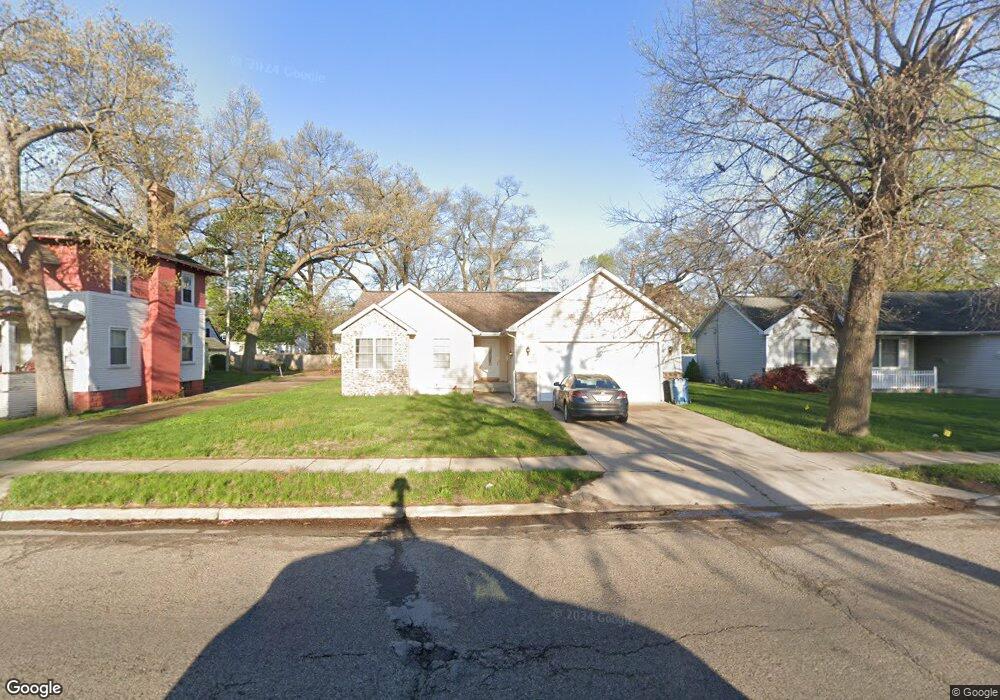
2317 Peck St Muskegon, MI 49444
Estimated Value: $115,000 - $189,634
3
Beds
2
Baths
1,184
Sq Ft
$125/Sq Ft
Est. Value
About This Home
This home is located at 2317 Peck St, Muskegon, MI 49444 and is currently estimated at $147,659, approximately $124 per square foot. 2317 Peck St is a home located in Muskegon County with nearby schools including Edgewood Elementary Academy, Dr. Martin Luther King Academy, and Muskegon Heights Academy.
Ownership History
Date
Name
Owned For
Owner Type
Purchase Details
Closed on
Jan 31, 2005
Sold by
Pwb Inc
Bought by
Shephers Kenneth W
Current Estimated Value
Home Financials for this Owner
Home Financials are based on the most recent Mortgage that was taken out on this home.
Original Mortgage
$95,500
Outstanding Balance
$48,669
Interest Rate
5.79%
Mortgage Type
Unknown
Estimated Equity
$98,990
Purchase Details
Closed on
May 3, 2004
Sold by
City Of Muskegon Heights
Bought by
Pwb Inc
Create a Home Valuation Report for This Property
The Home Valuation Report is an in-depth analysis detailing your home's value as well as a comparison with similar homes in the area
Home Values in the Area
Average Home Value in this Area
Purchase History
| Date | Buyer | Sale Price | Title Company |
|---|---|---|---|
| Shephers Kenneth W | -- | -- | |
| Pwb Inc | -- | -- | |
| Pwb Inc | -- | -- |
Source: Public Records
Mortgage History
| Date | Status | Borrower | Loan Amount |
|---|---|---|---|
| Open | Shephers Kenneth W | $95,500 |
Source: Public Records
Tax History Compared to Growth
Tax History
| Year | Tax Paid | Tax Assessment Tax Assessment Total Assessment is a certain percentage of the fair market value that is determined by local assessors to be the total taxable value of land and additions on the property. | Land | Improvement |
|---|---|---|---|---|
| 2025 | $1,523 | $82,400 | $0 | $0 |
| 2024 | $1,276 | $56,100 | $0 | $0 |
| 2023 | $1,434 | $46,100 | $0 | $0 |
| 2022 | $1,800 | $43,600 | $0 | $0 |
| 2021 | $1,749 | $40,400 | $0 | $0 |
| 2020 | $1,729 | $36,400 | $0 | $0 |
| 2019 | $1,697 | $40,500 | $0 | $0 |
| 2018 | $1,657 | $30,100 | $0 | $0 |
| 2017 | $1,510 | $29,800 | $0 | $0 |
| 2016 | $1,107 | $27,500 | $0 | $0 |
| 2015 | -- | $33,700 | $0 | $0 |
| 2014 | -- | $36,400 | $0 | $0 |
| 2013 | -- | $35,800 | $0 | $0 |
Source: Public Records
Map
Nearby Homes