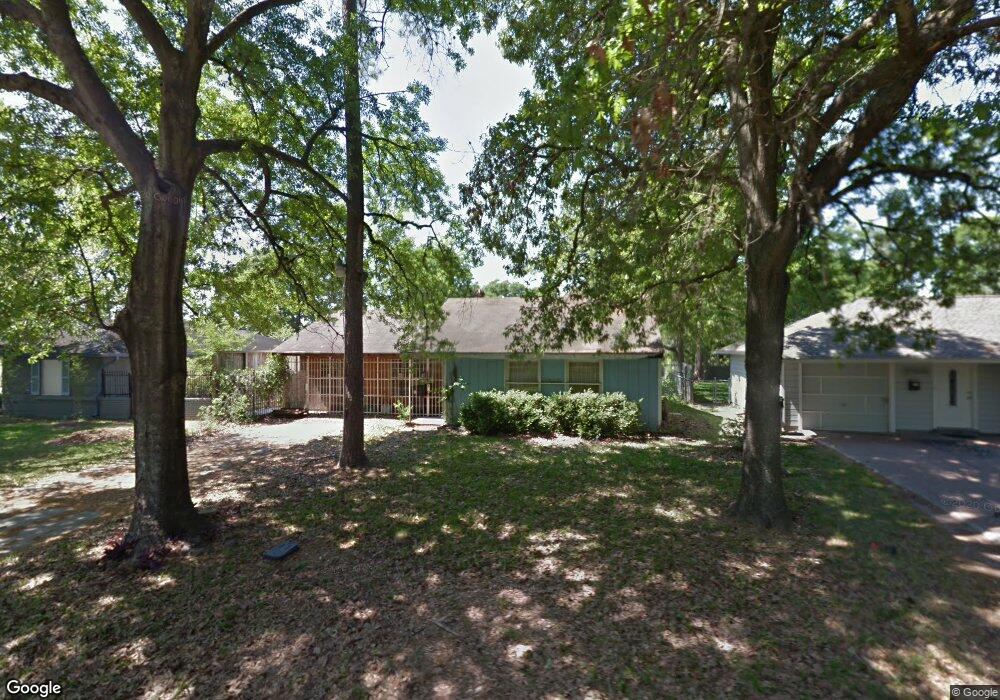
2318 Althea Dr Houston, TX 77018
Oak Forest-Garden Oaks NeighborhoodEstimated Value: $867,000 - $1,116,116
5
Beds
3
Baths
2,900
Sq Ft
$352/Sq Ft
Est. Value
About This Home
This home is located at 2318 Althea Dr, Houston, TX 77018 and is currently estimated at $1,020,029, approximately $351 per square foot. 2318 Althea Dr is a home located in Harris County with nearby schools including Stevens Elementary School, Frank Black Middle School, and Waltrip High School.
Ownership History
Date
Name
Owned For
Owner Type
Purchase Details
Closed on
May 31, 2017
Sold by
American Escrow & Closing Company
Bought by
Graham Mark and Graham Leah Maxwell
Current Estimated Value
Home Financials for this Owner
Home Financials are based on the most recent Mortgage that was taken out on this home.
Original Mortgage
$641,250
Outstanding Balance
$529,395
Interest Rate
3.75%
Mortgage Type
Adjustable Rate Mortgage/ARM
Estimated Equity
$490,634
Purchase Details
Closed on
Dec 5, 2012
Sold by
Garman James
Bought by
Perkins Nancy S
Home Financials for this Owner
Home Financials are based on the most recent Mortgage that was taken out on this home.
Original Mortgage
$365,000
Interest Rate
3.42%
Mortgage Type
New Conventional
Purchase Details
Closed on
Apr 21, 2008
Sold by
Redden Billie Jean and Redden Garry
Bought by
Garman James
Create a Home Valuation Report for This Property
The Home Valuation Report is an in-depth analysis detailing your home's value as well as a comparison with similar homes in the area
Home Values in the Area
Average Home Value in this Area
Purchase History
| Date | Buyer | Sale Price | Title Company |
|---|---|---|---|
| Graham Mark | -- | None Available | |
| American Escrow & Company | -- | None Available | |
| Perkins Nancy S | -- | None Available | |
| Garman James | -- | First American Title Tanglew |
Source: Public Records
Mortgage History
| Date | Status | Borrower | Loan Amount |
|---|---|---|---|
| Open | Graham Mark | $641,250 | |
| Previous Owner | Perkins Nancy S | $365,000 |
Source: Public Records
Tax History Compared to Growth
Tax History
| Year | Tax Paid | Tax Assessment Tax Assessment Total Assessment is a certain percentage of the fair market value that is determined by local assessors to be the total taxable value of land and additions on the property. | Land | Improvement |
|---|---|---|---|---|
| 2025 | $15,247 | $1,011,499 | $372,419 | $639,080 |
| 2024 | $15,247 | $986,183 | $350,934 | $635,249 |
| 2023 | $15,247 | $873,735 | $350,934 | $522,801 |
| 2022 | $18,556 | $888,675 | $307,962 | $580,713 |
| 2021 | $17,856 | $766,124 | $264,991 | $501,133 |
| 2020 | $18,495 | $763,738 | $264,991 | $498,747 |
| 2019 | $17,926 | $780,000 | $264,991 | $515,009 |
| 2018 | $16,296 | $644,000 | $214,857 | $429,143 |
| 2017 | $16,284 | $644,000 | $214,857 | $429,143 |
| 2016 | $16,284 | $644,000 | $214,857 | $429,143 |
| 2015 | $12,077 | $644,000 | $214,857 | $429,143 |
| 2014 | $12,077 | $669,643 | $136,076 | $533,567 |
Source: Public Records
Map
Nearby Homes
- 2222 Wakefield Dr
- 2210 Wakefield Dr
- 2215 Gardenia Dr
- 2122 Chippendale Rd
- 2103 Wakefield Dr
- 2314 Hialeah Dr
- 2318 Hialeah Dr
- 2211 Saxon Dr
- 2311 Saxon Dr
- 2114 Saxon Dr
- 2007 Lamonte Ln
- 2019 Saxon Dr
- 4218 T C Jester Blvd
- 2003 Ebony Ln
- 1918 Gardenia Dr
- 1910 Woodcrest Dr
- 2003 Du Barry Ln
- 1913 Ebony Ln
- 1826 Woodcrest Dr
- 2717 Oakwood Crest Ln
- 2314 Althea Dr
- 2322 Althea Dr
- 2310 Althea Dr
- 2323 Gardenia Dr
- 2319 Gardenia Dr
- 2327 Gardenia Dr
- 2315 Gardenia Dr
- 2306 Althea Dr
- 2319 Althea Dr
- 2323 Althea Dr
- 2315 Althea Dr
- 2311 Gardenia Dr
- 2311 Althea Dr
- 2302 Althea Dr
- 2307 Althea Dr
- 2322 Gardenia Dr
- 2318 Gardenia Dr
- 2222 Althea Dr
- 2303 Althea Dr
- 2226 Wakefield Dr