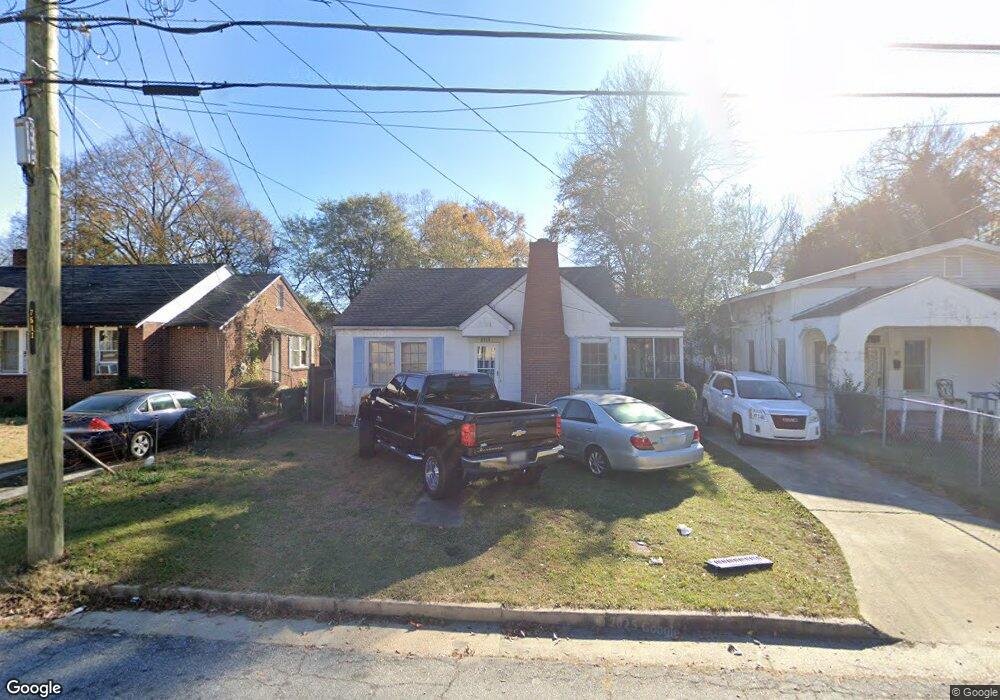
2318 Bell St Columbus, GA 31906
East Wynnton-Wynnton Hill NeighborhoodEstimated Value: $82,000 - $105,000
3
Beds
3
Baths
1,375
Sq Ft
$64/Sq Ft
Est. Value
About This Home
This home is located at 2318 Bell St, Columbus, GA 31906 and is currently estimated at $88,333, approximately $64 per square foot. 2318 Bell St is a home located in Muscogee County with nearby schools including Rigdon Road Elementary School, Baker Middle School, and Carver High School.
Ownership History
Date
Name
Owned For
Owner Type
Purchase Details
Closed on
Dec 19, 2014
Sold by
Citifinancial Servicing Ll
Bought by
Evans Robert E
Current Estimated Value
Purchase Details
Closed on
Aug 5, 2014
Sold by
Rutledge Lucille M
Bought by
Citifinancial Servicing Llc
Purchase Details
Closed on
Jan 24, 2008
Sold by
Rutledge Arthur
Bought by
Rutledge Lucille
Create a Home Valuation Report for This Property
The Home Valuation Report is an in-depth analysis detailing your home's value as well as a comparison with similar homes in the area
Home Values in the Area
Average Home Value in this Area
Purchase History
| Date | Buyer | Sale Price | Title Company |
|---|---|---|---|
| Evans Robert E | $17,500 | -- | |
| Citifinancial Servicing Llc | -- | -- | |
| Rutledge Lucille | -- | None Available |
Source: Public Records
Tax History
| Year | Tax Paid | Tax Assessment Tax Assessment Total Assessment is a certain percentage of the fair market value that is determined by local assessors to be the total taxable value of land and additions on the property. | Land | Improvement |
|---|---|---|---|---|
| 2025 | $884 | $22,580 | $3,812 | $18,768 |
| 2024 | -- | $22,580 | $3,812 | $18,768 |
| 2023 | $889 | $22,580 | $3,812 | $18,768 |
| 2022 | $517 | $12,668 | $3,812 | $8,856 |
| 2021 | $352 | $8,628 | $3,812 | $4,816 |
| 2020 | $352 | $8,628 | $3,812 | $4,816 |
| 2019 | $314 | $7,676 | $1,919 | $5,757 |
| 2018 | $314 | $7,676 | $1,919 | $5,757 |
| 2017 | $315 | $7,676 | $1,919 | $5,757 |
| 2016 | $289 | $7,000 | $1,960 | $5,040 |
| 2015 | $289 | $7,000 | $1,960 | $5,040 |
| 2014 | $629 | $15,207 | $1,960 | $13,247 |
| 2013 | -- | $15,207 | $1,960 | $13,247 |
Source: Public Records
Map
Nearby Homes
Your Personal Tour Guide
Ask me questions while you tour the home.