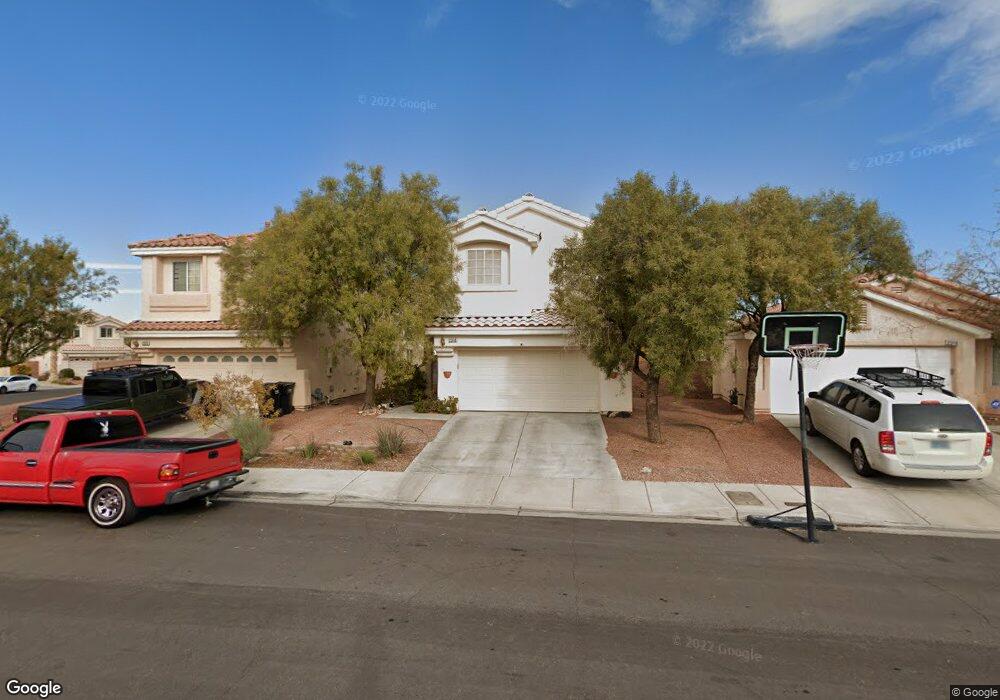
2318 Cut Bank Trail Henderson, NV 89052
MacDonald Ranch NeighborhoodEstimated Value: $501,167 - $545,000
3
Beds
3
Baths
1,903
Sq Ft
$278/Sq Ft
Est. Value
About This Home
This home is located at 2318 Cut Bank Trail, Henderson, NV 89052 and is currently estimated at $529,792, approximately $278 per square foot. 2318 Cut Bank Trail is a home located in Clark County with nearby schools including Frank S Lamping Elementary School, Del E. Webb Middle School, and Coronado High School.
Ownership History
Date
Name
Owned For
Owner Type
Purchase Details
Closed on
Sep 29, 2009
Sold by
Groll Susan L
Bought by
Almukahhal Raja and Bassa Amal A
Current Estimated Value
Home Financials for this Owner
Home Financials are based on the most recent Mortgage that was taken out on this home.
Original Mortgage
$158,400
Outstanding Balance
$103,749
Interest Rate
5.14%
Mortgage Type
New Conventional
Estimated Equity
$426,043
Purchase Details
Closed on
Feb 11, 2003
Sold by
Matthes Brandon and Matthes Joan
Bought by
Groll Susan L
Home Financials for this Owner
Home Financials are based on the most recent Mortgage that was taken out on this home.
Original Mortgage
$218,150
Interest Rate
5.93%
Purchase Details
Closed on
Oct 23, 2000
Sold by
D R Horton Inc
Bought by
Matthes Brandon and Matthes Joan
Home Financials for this Owner
Home Financials are based on the most recent Mortgage that was taken out on this home.
Original Mortgage
$122,400
Interest Rate
7.89%
Create a Home Valuation Report for This Property
The Home Valuation Report is an in-depth analysis detailing your home's value as well as a comparison with similar homes in the area
Home Values in the Area
Average Home Value in this Area
Purchase History
| Date | Buyer | Sale Price | Title Company |
|---|---|---|---|
| Almukahhal Raja | $198,000 | Nevada Title Las Vegas | |
| Groll Susan L | $224,900 | United Title Of Nevada | |
| Matthes Brandon | $148,571 | Old Republic Title Company |
Source: Public Records
Mortgage History
| Date | Status | Borrower | Loan Amount |
|---|---|---|---|
| Open | Almukahhal Raja | $158,400 | |
| Previous Owner | Groll Susan L | $218,150 | |
| Previous Owner | Matthes Brandon | $122,400 |
Source: Public Records
Tax History Compared to Growth
Tax History
| Year | Tax Paid | Tax Assessment Tax Assessment Total Assessment is a certain percentage of the fair market value that is determined by local assessors to be the total taxable value of land and additions on the property. | Land | Improvement |
|---|---|---|---|---|
| 2025 | $1,864 | $112,507 | $39,200 | $73,307 |
| 2024 | $1,810 | $112,507 | $39,200 | $73,307 |
| 2023 | $1,810 | $104,768 | $35,350 | $69,418 |
| 2022 | $1,757 | $91,085 | $27,650 | $63,435 |
| 2021 | $1,706 | $87,338 | $26,950 | $60,388 |
| 2020 | $1,654 | $86,736 | $26,950 | $59,786 |
| 2019 | $1,605 | $83,004 | $24,150 | $58,854 |
| 2018 | $1,559 | $75,634 | $19,250 | $56,384 |
| 2017 | $2,163 | $74,621 | $17,500 | $57,121 |
| 2016 | $1,477 | $72,187 | $15,050 | $57,137 |
| 2015 | $1,473 | $67,893 | $11,550 | $56,343 |
| 2014 | $1,430 | $53,032 | $8,400 | $44,632 |
Source: Public Records
Map
Nearby Homes
- 2310 Cut Bank Trail
- 2333 Silver Crew Pass
- 2309 Cut Bank Trail
- 2382 Sunburst View St
- 2410 Sunburst View St
- 1135 Hidden Mist St
- 2280 Bull Lake Dr
- 2420 Taragato Ave
- 2294 Dakota Sky Ct
- 2266 Driftwood Tide Ave
- 2547 Serenity Hollow Dr
- 981 Leadville Meadows Dr
- 1119 Pinto Horse Ave
- 1126 Winter Storm Dr
- 1104 Winter Storm Dr
- 955 Leadville Meadows Dr
- 2455 Silver Blossom Ln
- 2378 Falsetto Ave
- 2279 Pacini Ct
- 980 Upper Meadows Place
- 2316 Cut Bank Trail
- 2320 Cut Bank Trail
- 2314 Cut Bank Trail
- 2314 Cut Bank Trail Unit N
- 2312 Cut Bank Trail
- 2312 Cut Bank Trail Unit none
- 2343 Silver Crew Pass
- 2341 Silver Crew Pass
- 2345 Silver Crew Pass
- 2339 Silver Crew Pass
- 2332 Silver Crew Pass
- 2308 Cut Bank Trail
- 2337 Silver Crew Pass
- 2347 Silver Crew Pass
- 2311 Cut Bank Trail
- 2349 Silver Crew Pass
- 2335 Silver Crew Pass
- 2330 Silver Crew Pass
- 2306 Cut Bank Trail