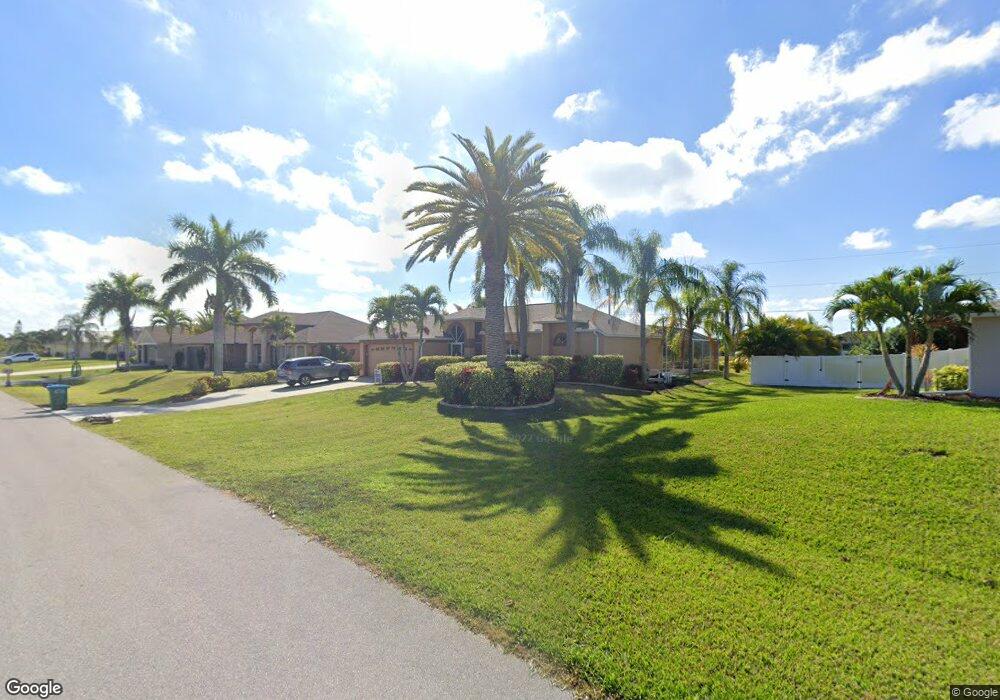
2318 SW 26th Terrace Unit 39 Cape Coral, FL 33914
Pelican NeighborhoodEstimated Value: $366,000 - $445,000
3
Beds
2
Baths
2,590
Sq Ft
$156/Sq Ft
Est. Value
About This Home
This home is located at 2318 SW 26th Terrace Unit 39, Cape Coral, FL 33914 and is currently estimated at $404,764, approximately $156 per square foot. 2318 SW 26th Terrace Unit 39 is a home located in Lee County with nearby schools including Cape Elementary School, Caloosa Elementary School, and Tropic Isles Elementary School.
Ownership History
Date
Name
Owned For
Owner Type
Purchase Details
Closed on
Apr 7, 2021
Sold by
Noack Frederick Herman and Noack Roylan Judith
Bought by
Gamache Tamara L
Current Estimated Value
Home Financials for this Owner
Home Financials are based on the most recent Mortgage that was taken out on this home.
Original Mortgage
$270,400
Outstanding Balance
$244,334
Interest Rate
3.05%
Mortgage Type
New Conventional
Estimated Equity
$160,430
Purchase Details
Closed on
Apr 20, 2020
Sold by
Mohan Collin and Mohan Elizabeth A
Bought by
Noack Frederick Herman and Boylan Judith A
Purchase Details
Closed on
Nov 25, 2008
Sold by
Jermier John M and Jermier Suszanne
Bought by
Mohan Collin and Mohan Elizabeth A
Home Financials for this Owner
Home Financials are based on the most recent Mortgage that was taken out on this home.
Original Mortgage
$101,600
Interest Rate
6.75%
Mortgage Type
Unknown
Create a Home Valuation Report for This Property
The Home Valuation Report is an in-depth analysis detailing your home's value as well as a comparison with similar homes in the area
Home Values in the Area
Average Home Value in this Area
Purchase History
| Date | Buyer | Sale Price | Title Company |
|---|---|---|---|
| Gamache Tamara L | $338,000 | Omnione Title Services | |
| Noack Frederick Herman | $225,000 | Superior Ttl & Closings Llc | |
| Mohan Collin | $127,000 | Paradise Professional Title |
Source: Public Records
Mortgage History
| Date | Status | Borrower | Loan Amount |
|---|---|---|---|
| Open | Gamache Tamara L | $270,400 | |
| Previous Owner | Mohan Collin | $101,600 | |
| Closed | Noack Frederick Herman | $0 |
Source: Public Records
Tax History Compared to Growth
Tax History
| Year | Tax Paid | Tax Assessment Tax Assessment Total Assessment is a certain percentage of the fair market value that is determined by local assessors to be the total taxable value of land and additions on the property. | Land | Improvement |
|---|---|---|---|---|
| 2025 | $6,178 | $322,997 | $88,825 | $202,634 |
| 2024 | $6,178 | $324,299 | $82,444 | $206,507 |
| 2023 | $6,606 | $346,520 | $0 | $0 |
| 2022 | $5,879 | $315,018 | $34,000 | $281,018 |
| 2021 | $4,631 | $220,026 | $34,000 | $186,026 |
| 2020 | $4,326 | $196,226 | $29,850 | $166,376 |
| 2019 | $5,375 | $184,115 | $24,100 | $160,015 |
| 2018 | $5,303 | $185,724 | $23,000 | $162,724 |
| 2017 | $5,111 | $177,646 | $16,000 | $161,646 |
| 2016 | $4,910 | $171,137 | $17,730 | $153,407 |
| 2015 | $4,656 | $148,507 | $11,556 | $136,951 |
| 2014 | $4,424 | $135,000 | $11,367 | $123,633 |
| 2013 | -- | $123,197 | $6,144 | $117,053 |
Source: Public Records
Map
Nearby Homes
- 2611 SW 23rd Place
- 2601 SW 24th Ave
- 2247 SW 27th St
- 2335 SW 27th St
- 2519 SW 24th Ave
- 2613 SW 22nd Place
- 2541 Surfside Blvd
- 2210 SW 25th Terrace
- 2506 SW 22nd Place
- 2590 Surfside Blvd
- 2509 Surfside Blvd
- 2501 Surfside Blvd
- 2118 SW 25th Terrace
- 2117 SW 26th St
- 2122 SW 25th St
- 2103 SW 26th Terrace
- 2317 SW 28th Terrace
- 2701 SW 21st Place
- 2337 SW 28th Terrace
- 2579 Surfside Blvd
- 2318 SW 26th Terrace
- 2314 SW 26th Terrace
- 2324 SW 26th Terrace
- 2325 SW 27th St
- 2310 SW 26th Terrace
- 2313 SW 27th St
- 2328 SW 26th Terrace
- 2321 SW 27th St Unit 6
- 2609 SW 24th Ave
- 2329 SW 27th St Unit 92
- 2309 SW 27th St
- 2306 SW 26th Terrace
- 2607 SW 24th Ave
- 2616 SW 24th Ave
- 2606 SW 23rd Place
- 2322 SW 27th St
- 2605 SW 24th Ave
- 2318 SW 27th St
- 2607 SW 23rd Place
- 2314 SW 27th St