Estimated Value: $230,000 - $310,000
3
Beds
1
Bath
1,607
Sq Ft
$160/Sq Ft
Est. Value
About This Home
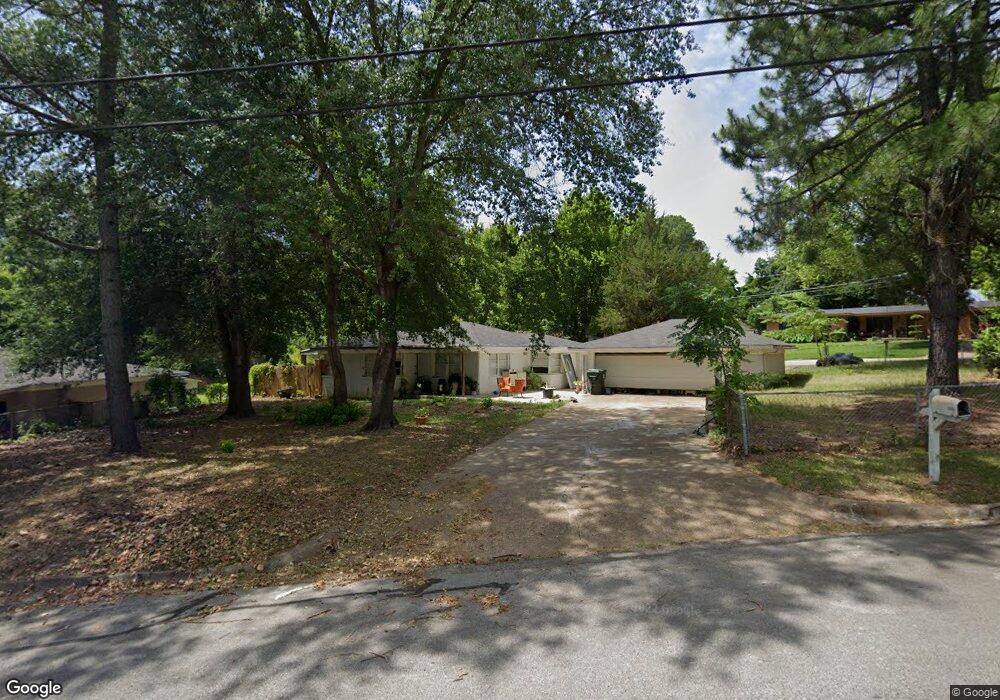
This home is located at 2319 2319 Alta Mira Dr, Tyler, TX 75701 and is currently estimated at $256,361, approximately $159 per square foot. 2319 2319 Alta Mira Dr is a home located in Smith County with nearby schools including Clarkston Elementary School, Hubbard Middle School, and Tyler Legacy High School.
Ownership History
Date
Name
Owned For
Owner Type
Purchase Details
Closed on
Jul 3, 2018
Sold by
Harris & Reynolds Properties Llc
Bought by
Nogueira Maldanado Petra and Nogueira Maldanado Magda Da Silva
Current Estimated Value
Home Financials for this Owner
Home Financials are based on the most recent Mortgage that was taken out on this home.
Original Mortgage
$118,000
Outstanding Balance
$102,066
Interest Rate
4.6%
Mortgage Type
Purchase Money Mortgage
Estimated Equity
$154,295
Purchase Details
Closed on
Sep 21, 2017
Sold by
Owens Betty L
Bought by
Harris & Reynolds Properties Llc
Home Financials for this Owner
Home Financials are based on the most recent Mortgage that was taken out on this home.
Original Mortgage
$51,130
Interest Rate
3.9%
Mortgage Type
Commercial
Create a Home Valuation Report for This Property
The Home Valuation Report is an in-depth analysis detailing your home's value as well as a comparison with similar homes in the area
Home Values in the Area
Average Home Value in this Area
Purchase History
| Date | Buyer | Sale Price | Title Company |
|---|---|---|---|
| Nogueira Maldanado Petra | -- | None Available | |
| Harris & Reynolds Properties Llc | -- | None Available |
Source: Public Records
Mortgage History
| Date | Status | Borrower | Loan Amount |
|---|---|---|---|
| Open | Nogueira Maldanado Petra | $118,000 | |
| Previous Owner | Harris & Reynolds Properties Llc | $51,130 |
Source: Public Records
Tax History Compared to Growth
Tax History
| Year | Tax Paid | Tax Assessment Tax Assessment Total Assessment is a certain percentage of the fair market value that is determined by local assessors to be the total taxable value of land and additions on the property. | Land | Improvement |
|---|---|---|---|---|
| 2025 | $3,282 | $222,947 | $48,958 | $173,989 |
| 2024 | $3,282 | $221,220 | $42,057 | $179,163 |
| 2023 | $4,327 | $248,219 | $42,057 | $206,162 |
| 2022 | $4,043 | $206,341 | $28,038 | $178,303 |
| 2021 | $2,728 | $130,042 | $18,120 | $111,922 |
| 2020 | $2,767 | $129,291 | $18,120 | $111,171 |
| 2019 | $2,608 | $119,249 | $14,858 | $104,391 |
| 2018 | $1,945 | $89,436 | $12,080 | $77,356 |
| 2017 | $1,909 | $89,436 | $12,080 | $77,356 |
| 2016 | $2,051 | $96,081 | $12,080 | $84,001 |
| 2015 | $1,690 | $92,800 | $12,080 | $80,720 |
| 2014 | $1,690 | $90,174 | $12,080 | $78,094 |
Source: Public Records
Map
Nearby Homes
- 2226 Mimosa Dr
- 2830 Juniper Ln
- 2512 Alta Mira Dr
- 2014 Miller Dr
- The Dawson Plan at New Home Living at Medina
- 2949 Medina Dr
- The Hubbard Plan at New Home Living at Medina
- 2716 Royal Village Way
- 2002 E Faulkner St
- 2509 Delmar Dr
- 3024 Royal Garden Rd
- 2026 Neeley St
- 2631 Amy Ln
- 3801 Old Troup Hwy
- 2417 Riviera Dr
- 1931 Sterling Dr
- 2716 Roanoke Ln
- 2126 McDonald Rd
- 2827 Fairfax Dr
- 2938 Dinah Ln
- 2319 Alta Mira Dr
- 2311 Alta Mira Dr
- 3020 3020 Terilinga Dr
- 3011 Terilinga Dr
- 3013 Terilinga Dr
- 2333 Alta Mira Dr
- 2307 2307 Alta Mira
- 3003 Terilinga Dr
- 3021 3021 Terilinga Dr
- 2310 Alta Mira Dr
- 2307 Alta Mira Dr
- 3021 Terilinga Dr
- 2308 2308 Alta Mira Dr
- 2308 Alta Mira Dr
- 2328 2328 Alta Mira
- 2328 Alta Mira Dr
- 3024 Terilinga Dr
- 2301 Alta Mira Dr
- 3025 Terilinga Dr
- 2332 2332 Alta Mira Dr