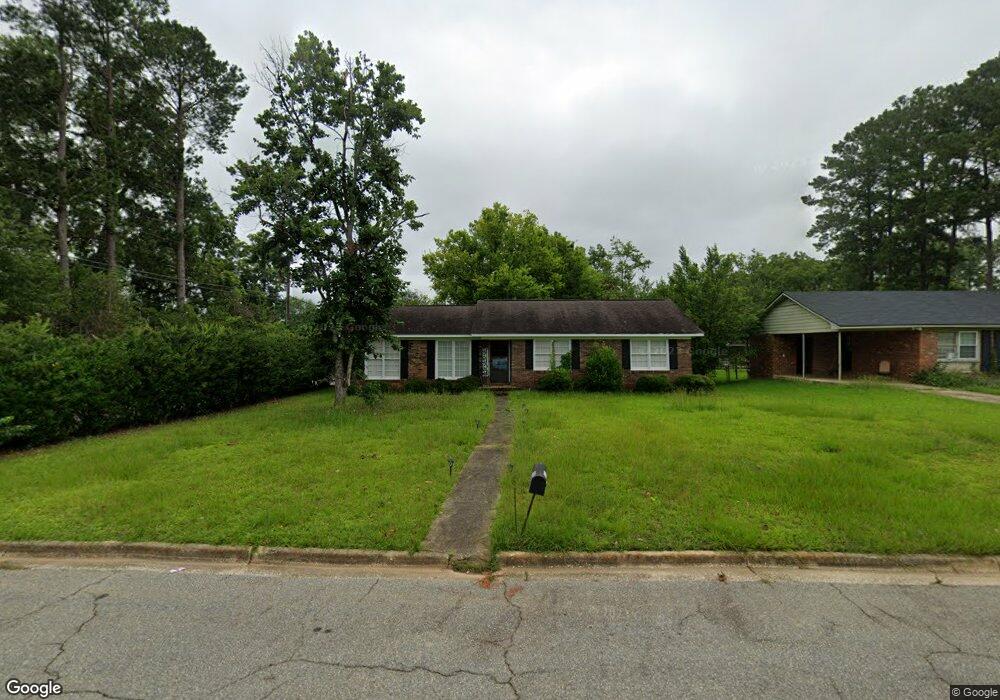
2319 Cascade Ln Albany, GA 31707
Sherwood NeighborhoodEstimated Value: $133,634 - $161,000
3
Beds
2
Baths
1,433
Sq Ft
$105/Sq Ft
Est. Value
About This Home
This home is located at 2319 Cascade Ln, Albany, GA 31707 and is currently estimated at $150,909, approximately $105 per square foot. 2319 Cascade Ln is a home located in Dougherty County with nearby schools including Sherwood Acres Elementary School, Merry Acres Middle School, and Westover High School.
Ownership History
Date
Name
Owned For
Owner Type
Purchase Details
Closed on
Nov 20, 2007
Sold by
Fussell Charles H Exec Of Estate
Bought by
Unified Credit Trust
Current Estimated Value
Purchase Details
Closed on
Oct 4, 2006
Sold by
American General Financial
Bought by
Fussell Charles H and Fussell Amelia
Home Financials for this Owner
Home Financials are based on the most recent Mortgage that was taken out on this home.
Original Mortgage
$72,500
Interest Rate
6.5%
Mortgage Type
New Conventional
Purchase Details
Closed on
Mar 7, 2006
Sold by
Evans Marvin L
Bought by
American General Financial Svc
Purchase Details
Closed on
Jun 22, 2000
Sold by
Anderson John L
Bought by
Evans Marvin L
Purchase Details
Closed on
Dec 30, 1999
Sold by
Vincent Terri Schmidt Aka Terri Ann Sc
Bought by
Anderson John L
Purchase Details
Closed on
Jul 21, 1989
Sold by
Fisher Donald Etal
Bought by
Schmidt Terri Ann
Create a Home Valuation Report for This Property
The Home Valuation Report is an in-depth analysis detailing your home's value as well as a comparison with similar homes in the area
Home Values in the Area
Average Home Value in this Area
Purchase History
| Date | Buyer | Sale Price | Title Company |
|---|---|---|---|
| Unified Credit Trust | -- | -- | |
| Fussell Charles H | $95,000 | -- | |
| American General Financial Svc | $91,850 | -- | |
| Evans Marvin L | $84,900 | -- | |
| Anderson John L | $55,700 | -- | |
| Schmidt Terri Ann | $60,000 | -- |
Source: Public Records
Mortgage History
| Date | Status | Borrower | Loan Amount |
|---|---|---|---|
| Previous Owner | Fussell Charles H | $72,500 |
Source: Public Records
Tax History Compared to Growth
Tax History
| Year | Tax Paid | Tax Assessment Tax Assessment Total Assessment is a certain percentage of the fair market value that is determined by local assessors to be the total taxable value of land and additions on the property. | Land | Improvement |
|---|---|---|---|---|
| 2024 | $1,523 | $31,920 | $6,600 | $25,320 |
| 2023 | $1,487 | $31,920 | $6,600 | $25,320 |
| 2022 | $1,493 | $31,920 | $6,600 | $25,320 |
| 2021 | $1,384 | $31,920 | $6,600 | $25,320 |
| 2020 | $1,387 | $31,920 | $6,600 | $25,320 |
| 2019 | $1,392 | $31,920 | $6,600 | $25,320 |
| 2018 | $0 | $31,920 | $6,600 | $25,320 |
| 2017 | $1,282 | $31,920 | $6,600 | $25,320 |
| 2016 | $1,509 | $36,960 | $6,600 | $30,360 |
| 2015 | $1,513 | $36,960 | $6,600 | $30,360 |
| 2014 | $1,522 | $37,640 | $7,280 | $30,360 |
Source: Public Records
Map
Nearby Homes
- 2316 Pembroke Dr
- 2102 Acker Dr
- 2515 Whispering Pines Rd
- 1913 Forest Glen Dr
- 2017 Acker Dr
- 2024 Stuart Ave
- 2611 Pine Valley Rd
- 2007 Acker Dr
- 2004 Gail Ave
- 1929 Stuart Ave
- 1927 Stuart Ave
- 2402 Hilltop Dr
- 2741 Mclain Ln
- 2440 Bassford Ln
- 2708 Elton St
- 1801 Oak Glen Ln
- 1804 Acker Dr
- 2012 W Lakeridge Dr
- 1234 Hilltop Dr
- 2526 Hilltop Dr
- 2317 Cascade Ln
- 2208 Nottingham Way
- 2210 Nottingham Way
- 2315 Cascade Ln
- 2318 Sharon Dr
- 2212 Nottingham Way
- 2316 Sharon Dr
- 2318 Sharon Ave
- 2318 Cascade Ln
- 2316 Cascade Ln
- 2313 Cascade Ln
- 2206 Nottingham Way
- 2314 Sharon Dr
- 2214 Nottingham Way
- 2314 Cascade Ln
- 2312 Sharon Dr
- 2314 Sharon Ave
- 2204 Nottingham Way
- 2312 Cascade Ln
- 2311 Cascade Ln