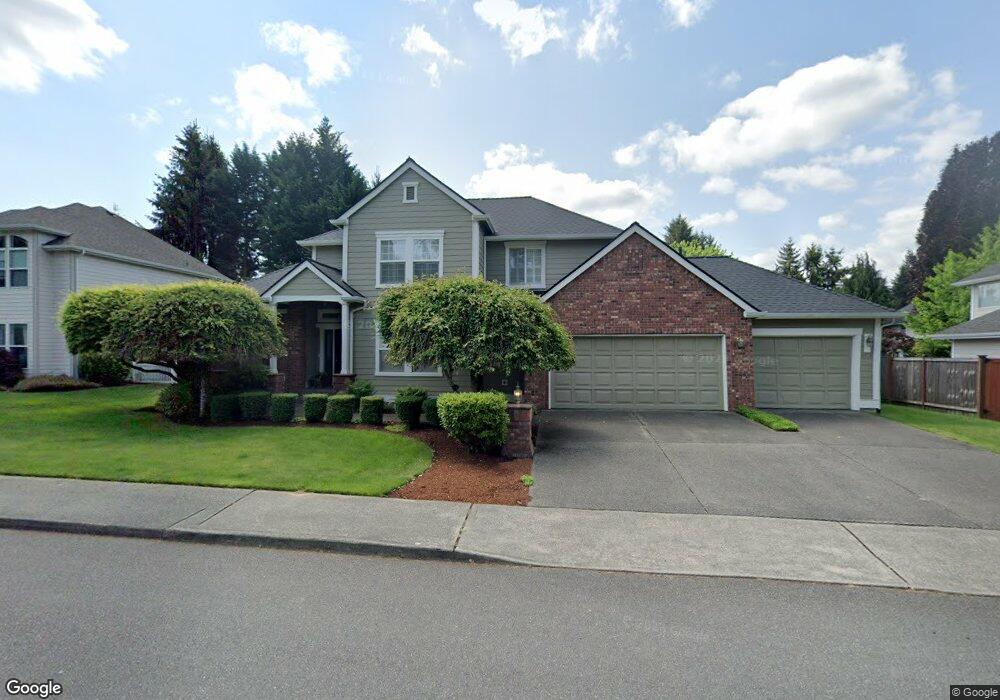
2319 Cedar Park Loop SE Olympia, WA 98501
Estimated Value: $678,105 - $915,000
3
Beds
3
Baths
2,256
Sq Ft
$334/Sq Ft
Est. Value
About This Home
This home is located at 2319 Cedar Park Loop SE, Olympia, WA 98501 and is currently estimated at $754,526, approximately $334 per square foot. 2319 Cedar Park Loop SE is a home located in Thurston County with nearby schools including Centennial Elementary School, Washington Middle School, and Olympia High School.
Ownership History
Date
Name
Owned For
Owner Type
Purchase Details
Closed on
Mar 2, 2001
Sold by
Phillips Glen Donald
Bought by
Phillips Elaine
Current Estimated Value
Purchase Details
Closed on
Oct 15, 1997
Sold by
Steve Ackelson Construction Company Inc
Bought by
Phillips Glen D and Phillips Elaine M
Home Financials for this Owner
Home Financials are based on the most recent Mortgage that was taken out on this home.
Original Mortgage
$189,300
Outstanding Balance
$30,520
Interest Rate
7.49%
Estimated Equity
$724,006
Purchase Details
Closed on
May 15, 1997
Sold by
Hanna Suhail N and Hanna Joan R
Bought by
Steve Ackelson Construction Company Inc
Home Financials for this Owner
Home Financials are based on the most recent Mortgage that was taken out on this home.
Original Mortgage
$177,450
Interest Rate
8.14%
Create a Home Valuation Report for This Property
The Home Valuation Report is an in-depth analysis detailing your home's value as well as a comparison with similar homes in the area
Home Values in the Area
Average Home Value in this Area
Purchase History
| Date | Buyer | Sale Price | Title Company |
|---|---|---|---|
| Phillips Elaine | -- | Chicago Title Insurance Co | |
| Phillips Glen D | $236,647 | Thurston County Title Co | |
| Steve Ackelson Construction Company Inc | -- | Thurston County Title Co |
Source: Public Records
Mortgage History
| Date | Status | Borrower | Loan Amount |
|---|---|---|---|
| Open | Phillips Glen D | $189,300 | |
| Previous Owner | Steve Ackelson Construction Company Inc | $177,450 |
Source: Public Records
Tax History Compared to Growth
Tax History
| Year | Tax Paid | Tax Assessment Tax Assessment Total Assessment is a certain percentage of the fair market value that is determined by local assessors to be the total taxable value of land and additions on the property. | Land | Improvement |
|---|---|---|---|---|
| 2024 | $6,584 | $623,500 | $167,900 | $455,600 |
| 2023 | $6,584 | $629,700 | $163,100 | $466,600 |
| 2022 | $5,988 | $610,400 | $106,700 | $503,700 |
| 2021 | $5,504 | $501,300 | $88,400 | $412,900 |
| 2020 | $5,496 | $426,400 | $107,400 | $319,000 |
| 2019 | $4,874 | $415,400 | $104,600 | $310,800 |
| 2018 | $5,042 | $374,400 | $87,900 | $286,500 |
| 2017 | $4,495 | $359,850 | $76,250 | $283,600 |
| 2016 | $4,171 | $334,550 | $75,050 | $259,500 |
| 2014 | -- | $333,650 | $75,050 | $258,600 |
Source: Public Records
Map
Nearby Homes
- 3804 Reading St SE
- 2605 43rd Ln SE
- 4019 Wexford Loop SE
- 4440 Governor Ln SE Unit 4440
- 3525 Humphrey St SE
- 2001 Holiday Cir SE
- 2813 Wilderness Dr SE Unit 2811
- 2534 Wedgewood Ct SE
- 4507 Trenton Loop SE
- 4932 Siskiyou Loop SE
- 5113 Brassfield Dr SE
- 2807 Kirkaldy Ct SE
- 2802 Burnaby Park Loop SE
- 4509 Briggs Dr SE
- 2345 55th Ave SE
- 3401 Bittersweet St SE
- 3502 40th Ave SE
- 2727 Fir St SE
- 2825 Haig Dr SE
- 3005 Powder Ridge St SE
- 2313 Cedar Park Loop SE
- 2323 Cedar Park Loop SE
- 2523 Cedar Park Loop SE
- 2420 Cedar Park Loop SE
- 2519 Cedar Park Loop SE
- 2320 Cedar Park Loop SE
- 2316 Cedar Park Loop SE
- 2515 Cedar Park Loop SE
- 2533 Cedar Park Loop SE
- 2327 Cedar Park Loop SE
- 2309 Cedar Park Loop SE
- 2324 Cedar Park Loop SE
- 2312 Cedar Park Loop SE
- 2520 Cedar Park Loop SE
- 2524 Cedar Park Loop SE
- 2328 Cedar Park Loop SE
- 2511 Cedar Park Loop SE
- 2331 Cedar Park Loop SE
- 2528 Cedar Park Loop SE
- 2308 Cedar Park Loop SE