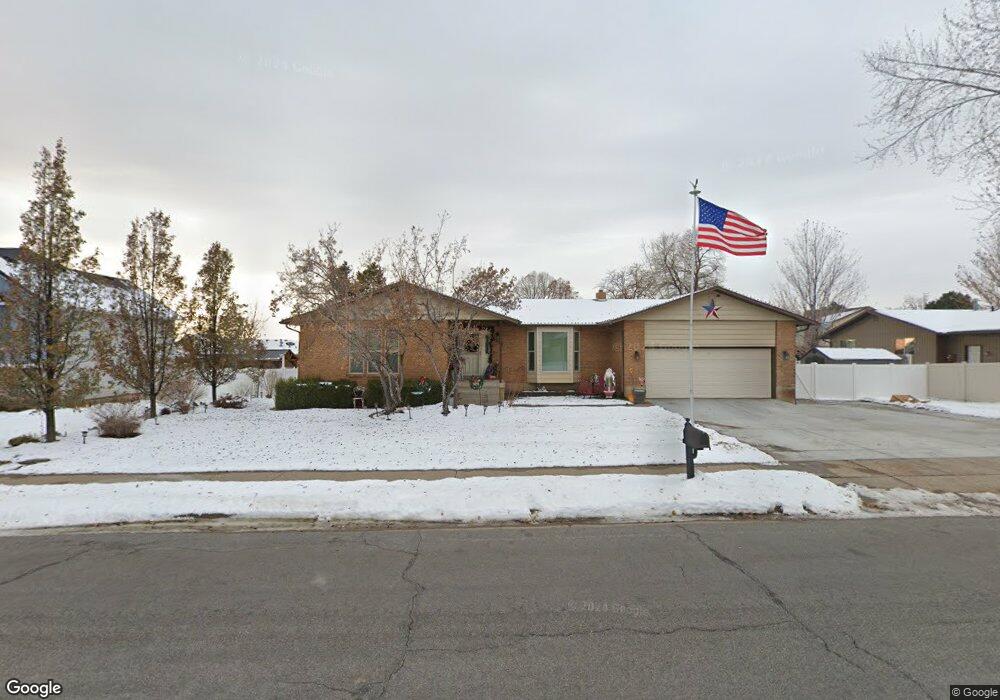
2319 N 2350 E Layton, UT 84040
Estimated Value: $553,000 - $586,000
5
Beds
4
Baths
2,996
Sq Ft
$193/Sq Ft
Est. Value
About This Home
This home is located at 2319 N 2350 E, Layton, UT 84040 and is currently estimated at $577,120, approximately $192 per square foot. 2319 N 2350 E is a home located in Davis County with nearby schools including Sarah Jane Adams Elementary School, North Layton Junior High School, and Northridge High School.
Ownership History
Date
Name
Owned For
Owner Type
Purchase Details
Closed on
Feb 10, 2009
Sold by
Kirchhefer William R and Kirchhefer Michelle L
Bought by
Kirchhefer Michelle L and Kirchhefer William R
Current Estimated Value
Home Financials for this Owner
Home Financials are based on the most recent Mortgage that was taken out on this home.
Original Mortgage
$174,400
Outstanding Balance
$107,781
Interest Rate
5.01%
Mortgage Type
New Conventional
Estimated Equity
$469,339
Purchase Details
Closed on
Dec 22, 1998
Sold by
Kirchhefer William R and Kirchhefer Michelle L
Bought by
Kirchhefer William R and Kirchhefer Michelle L
Purchase Details
Closed on
Nov 21, 1997
Sold by
Wong Errol S and Wong Linda J
Bought by
Kirchhefer William R and Kirchhefer Michelle I
Home Financials for this Owner
Home Financials are based on the most recent Mortgage that was taken out on this home.
Original Mortgage
$151,200
Interest Rate
10%
Create a Home Valuation Report for This Property
The Home Valuation Report is an in-depth analysis detailing your home's value as well as a comparison with similar homes in the area
Home Values in the Area
Average Home Value in this Area
Purchase History
| Date | Buyer | Sale Price | Title Company |
|---|---|---|---|
| Kirchhefer Michelle L | -- | Heritage West Title Ins Age | |
| Kirchhefer William R | -- | First American Title Co | |
| Kirchhefer William R | -- | Security Title Company |
Source: Public Records
Mortgage History
| Date | Status | Borrower | Loan Amount |
|---|---|---|---|
| Open | Kirchhefer Michelle L | $174,400 | |
| Closed | Kirchhefer William R | $151,200 |
Source: Public Records
Tax History
| Year | Tax Paid | Tax Assessment Tax Assessment Total Assessment is a certain percentage of the fair market value that is determined by local assessors to be the total taxable value of land and additions on the property. | Land | Improvement |
|---|---|---|---|---|
| 2025 | $234 | $299,750 | $136,936 | $162,814 |
| 2024 | $205 | $288,750 | $158,463 | $130,287 |
| 2023 | $176 | $522,000 | $208,887 | $313,113 |
| 2022 | $635 | $295,900 | $112,462 | $183,438 |
| 2021 | $155 | $383,000 | $171,823 | $211,177 |
| 2020 | $145 | $334,000 | $141,804 | $192,196 |
| 2019 | $128 | $319,000 | $126,092 | $192,908 |
| 2018 | $117 | $296,000 | $100,265 | $195,735 |
| 2016 | $77 | $147,180 | $52,330 | $94,850 |
| 2015 | $2,052 | $138,545 | $52,330 | $86,215 |
| 2014 | $53 | $128,632 | $52,330 | $76,302 |
| 2013 | -- | $121,945 | $33,932 | $88,013 |
Source: Public Records
Map
Nearby Homes
- 2202 N 2300 E
- 2597 N 2300 E
- 2563 E 2250 N
- 2340 N 2050 E
- 2316 E 1975 N
- 2273 N 1975 E
- 2547 E 1900 N
- 1907 N Bridge Ct
- 2189 N 1950 E
- 2353 Canyon View Dr
- 1935 Deere Valley Dr
- 2391 Kays Creek Dr
- 2011 Dan Dr
- 1731 E 2825 N
- 1843 Hayes Dr
- 1821 E Whitetail Way
- 2826 N 1600 E
- 1827 E Whitetail Dr
- 1444 E 2400 N
- 2096 N 1450 E
Your Personal Tour Guide
Ask me questions while you tour the home.