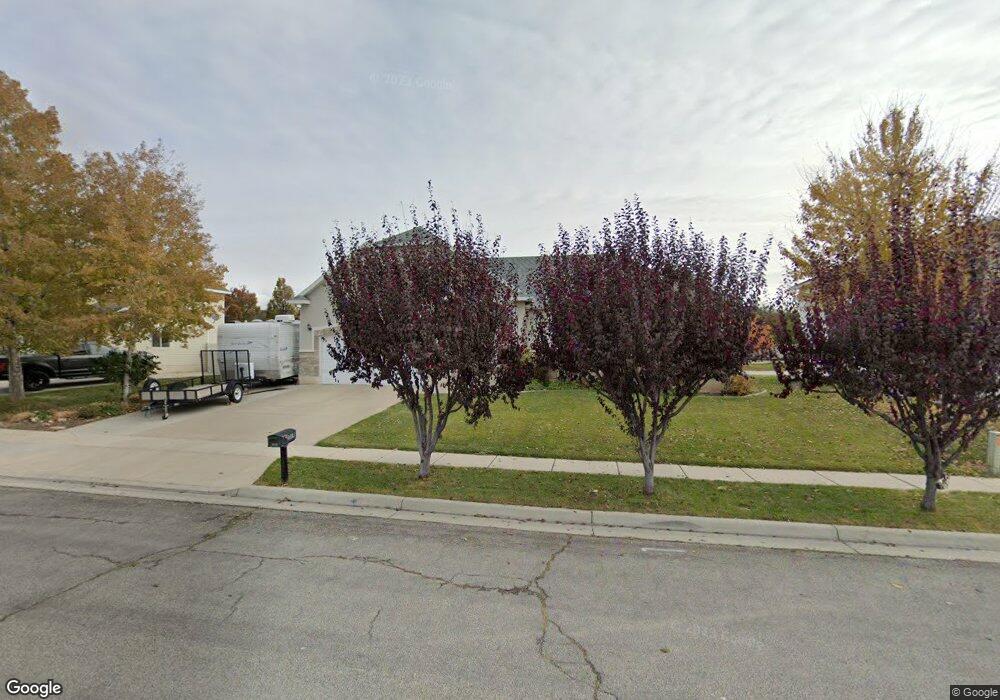
2319 S 1520 W Syracuse, UT 84075
Estimated Value: $514,000 - $553,751
5
Beds
2
Baths
1,374
Sq Ft
$394/Sq Ft
Est. Value
About This Home
This home is located at 2319 S 1520 W, Syracuse, UT 84075 and is currently estimated at $541,938, approximately $394 per square foot. 2319 S 1520 W is a home located in Davis County with nearby schools including Cook School, Legacy Junior High School, and Clearfield High School.
Ownership History
Date
Name
Owned For
Owner Type
Purchase Details
Closed on
Nov 25, 2014
Sold by
Jauregui Jennifer and St Clair Jennifer Lynn
Bought by
St Clair Jared
Current Estimated Value
Home Financials for this Owner
Home Financials are based on the most recent Mortgage that was taken out on this home.
Original Mortgage
$180,000
Outstanding Balance
$137,478
Interest Rate
3.92%
Mortgage Type
Credit Line Revolving
Estimated Equity
$404,460
Purchase Details
Closed on
Sep 9, 1997
Sold by
Rainey Construction Inc
Bought by
Stclair Jared and Stclair Jennifer Lynn
Home Financials for this Owner
Home Financials are based on the most recent Mortgage that was taken out on this home.
Original Mortgage
$155,562
Interest Rate
7.34%
Purchase Details
Closed on
Oct 1, 1996
Sold by
Bretwood Co Inc
Bought by
Rainey Construction Inc
Home Financials for this Owner
Home Financials are based on the most recent Mortgage that was taken out on this home.
Original Mortgage
$122,500
Interest Rate
7.95%
Mortgage Type
Construction
Create a Home Valuation Report for This Property
The Home Valuation Report is an in-depth analysis detailing your home's value as well as a comparison with similar homes in the area
Home Values in the Area
Average Home Value in this Area
Purchase History
| Date | Buyer | Sale Price | Title Company |
|---|---|---|---|
| St Clair Jared | -- | Eagle Gate Title Ins | |
| Stclair Jared | -- | First American Title Co | |
| Rainey Construction Inc | -- | Security Title Company |
Source: Public Records
Mortgage History
| Date | Status | Borrower | Loan Amount |
|---|---|---|---|
| Open | St Clair Jared | $180,000 | |
| Closed | Stclair Jared | $155,562 | |
| Previous Owner | Rainey Construction Inc | $122,500 | |
| Closed | Rainey Construction Inc | $11,960 |
Source: Public Records
Tax History
| Year | Tax Paid | Tax Assessment Tax Assessment Total Assessment is a certain percentage of the fair market value that is determined by local assessors to be the total taxable value of land and additions on the property. | Land | Improvement |
|---|---|---|---|---|
| 2025 | $2,828 | $272,800 | $128,486 | $144,314 |
| 2024 | $2,701 | $262,350 | $109,715 | $152,635 |
| 2023 | $2,605 | $461,000 | $152,674 | $308,326 |
| 2022 | $2,789 | $270,600 | $87,406 | $183,194 |
| 2021 | $2,457 | $369,000 | $129,562 | $239,438 |
| 2020 | $2,194 | $319,000 | $111,124 | $207,876 |
| 2019 | $2,104 | $302,000 | $110,748 | $191,252 |
| 2018 | $1,951 | $278,000 | $105,810 | $172,190 |
| 2016 | $1,800 | $134,475 | $40,534 | $93,941 |
| 2015 | $1,743 | $124,080 | $40,534 | $83,546 |
| 2014 | $1,766 | $128,115 | $40,534 | $87,581 |
| 2013 | -- | $113,453 | $33,689 | $79,764 |
Source: Public Records
Map
Nearby Homes
- 1294 W 2375 S
- 1284 W 2375 S
- 1283 W 2375 S
- 1699 W 2115 S
- 2366 S 1230 W
- 2621 S 1580 W
- 1196 W 2325 S
- 2312 S 1800 W
- 1876 W 2400 S
- 1134 W 2275 S
- 1857 W 2575 S
- 2742 S Allison Way Unit 212
- 1116 W 2325 S
- 2721 S Allison Way
- 1643 W 2700 S Unit 216
- 2001 S 1800 W
- 1653 W 2700 S Unit 218
- 2718 S 1710 W Unit 227
- 1667 W 2770 S Unit 206
- 1705 W 2770 S
Your Personal Tour Guide
Ask me questions while you tour the home.