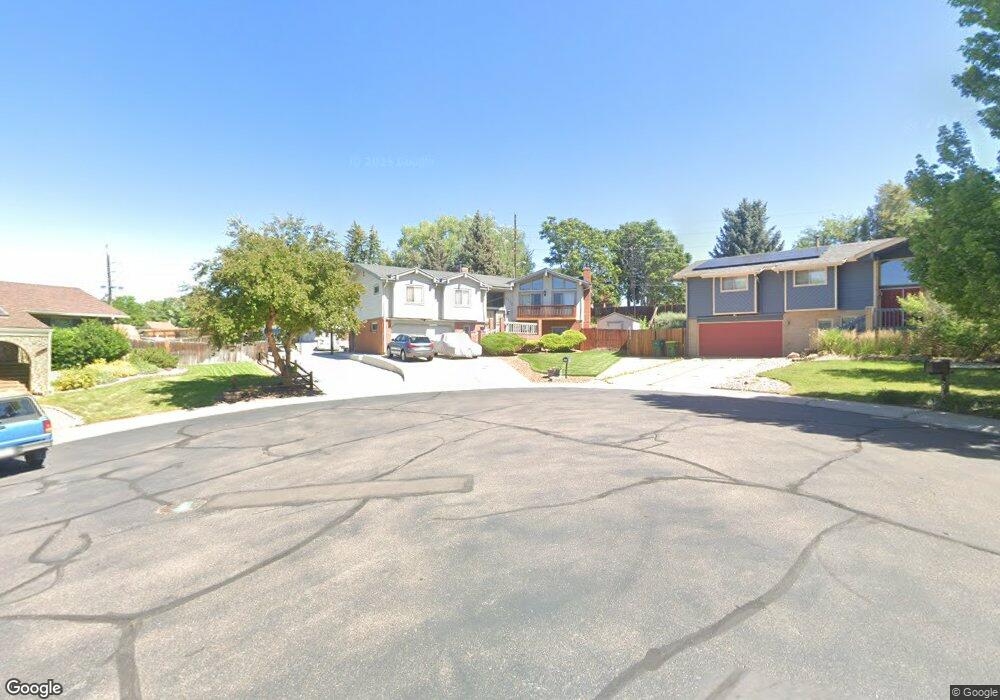
2319 S Yukon Ct Lakewood, CO 80227
Carmody NeighborhoodEstimated Value: $781,000 - $843,000
5
Beds
3
Baths
2,867
Sq Ft
$285/Sq Ft
Est. Value
About This Home
This home is located at 2319 S Yukon Ct, Lakewood, CO 80227 and is currently estimated at $818,277, approximately $285 per square foot. 2319 S Yukon Ct is a home located in Jefferson County with nearby schools including Westgate Elementary School, Carmody Middle School, and Bear Creek High School.
Ownership History
Date
Name
Owned For
Owner Type
Purchase Details
Closed on
Jun 28, 2019
Sold by
Garcia Connie L
Bought by
Braun Brian and Braun Jaime D
Current Estimated Value
Home Financials for this Owner
Home Financials are based on the most recent Mortgage that was taken out on this home.
Original Mortgage
$522,000
Outstanding Balance
$454,259
Interest Rate
3.5%
Mortgage Type
Adjustable Rate Mortgage/ARM
Estimated Equity
$364,018
Purchase Details
Closed on
Jun 26, 2019
Sold by
Connie L Garcia Trust
Bought by
Garcia Connie L
Home Financials for this Owner
Home Financials are based on the most recent Mortgage that was taken out on this home.
Original Mortgage
$522,000
Outstanding Balance
$454,259
Interest Rate
3.5%
Mortgage Type
Adjustable Rate Mortgage/ARM
Estimated Equity
$364,018
Purchase Details
Closed on
Apr 25, 2019
Sold by
Connie L Garcia Trust
Bought by
Garcia Connie L
Purchase Details
Closed on
Aug 29, 2016
Sold by
Garcia Connie Lee
Bought by
Connie L Garcia Trust
Create a Home Valuation Report for This Property
The Home Valuation Report is an in-depth analysis detailing your home's value as well as a comparison with similar homes in the area
Home Values in the Area
Average Home Value in this Area
Purchase History
| Date | Buyer | Sale Price | Title Company |
|---|---|---|---|
| Braun Brian | $580,000 | Land Title Guarantee Co | |
| Garcia Connie L | -- | Land Title Guarantee Co | |
| Garcia Connie L | -- | None Available | |
| Connie L Garcia Trust | -- | None Available |
Source: Public Records
Mortgage History
| Date | Status | Borrower | Loan Amount |
|---|---|---|---|
| Open | Braun Brian | $522,000 |
Source: Public Records
Tax History Compared to Growth
Tax History
| Year | Tax Paid | Tax Assessment Tax Assessment Total Assessment is a certain percentage of the fair market value that is determined by local assessors to be the total taxable value of land and additions on the property. | Land | Improvement |
|---|---|---|---|---|
| 2024 | $4,943 | $52,621 | $21,432 | $31,189 |
| 2023 | $4,943 | $52,621 | $21,432 | $31,189 |
| 2022 | $3,920 | $40,679 | $15,999 | $24,680 |
| 2021 | $3,967 | $41,850 | $16,460 | $25,390 |
| 2020 | $3,262 | $34,512 | $14,192 | $20,320 |
| 2019 | $2,548 | $34,512 | $14,192 | $20,320 |
| 2018 | $2,444 | $32,542 | $13,416 | $19,126 |
| 2017 | $2,156 | $32,542 | $13,416 | $19,126 |
| 2016 | $2,088 | $30,951 | $9,754 | $21,197 |
| 2015 | $1,054 | $30,951 | $9,754 | $21,197 |
| 2014 | $1,938 | $27,445 | $8,651 | $18,794 |
Source: Public Records
Map
Nearby Homes
- 2146 S Yarrow St
- 2125 S Wadsworth Blvd
- 2460 S Ammons St
- 7446 W Evans Place
- 7488 W Pacific Ln
- 7500 W Vassar Ave
- 8346 W Woodard Dr
- 7226 W Evans Ave
- 8321 W Evans Ave
- 7203 W Pacific Ave
- 7505 W Yale Ave Unit 2103
- 8696 W Iliff Ave
- 7101 W Yale Ave Unit 3904
- 2538 S Dover Way
- 1868 S Ammons St Unit A
- 7100 W Yale Ave
- 6969 W Yale Ave Unit 81
- 6969 W Yale Ave Unit 32
- 6831 W Yale Ave
- 6702 W Asbury Place
- 2329 S Yukon Ct
- 2316 S Yukon Ct
- 2324 S Yarrow Way
- 7777 Morrison Rd
- 2328 S Yukon Ct
- 2334 S Yarrow Way
- 2349 S Yukon Ct
- 2338 S Yukon Ct
- 2314 S Yarrow Way
- 2344 S Yarrow Way
- 7740 W Woodard Cir
- 2348 S Yukon Ct
- 7750 W Woodard Cir
- 7730 W Woodard Cir
- 2255 S Wadsworth Blvd Unit 109
- 2255 S Wadsworth Blvd Unit 205
- 2255 S Wadsworth Blvd Unit 206
- 2255 S Wadsworth Blvd
- 2323 S Yarrow Way
- 2333 S Yarrow Way