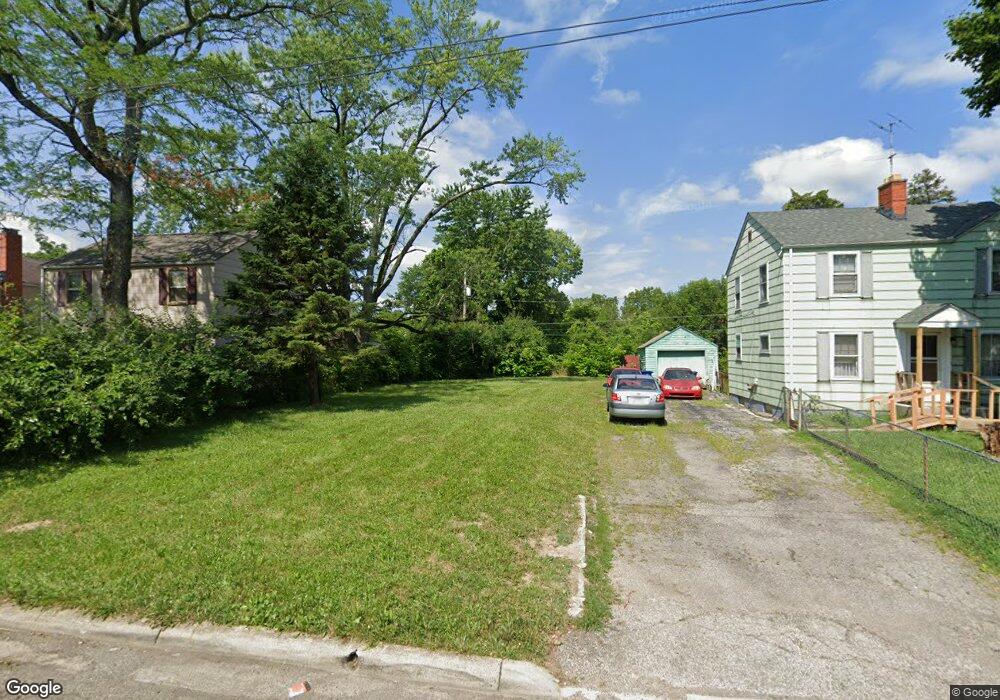
2319 Traymore Place Columbus, OH 43211
East Linden NeighborhoodEstimated Value: $85,991
3
Beds
1
Bath
1,000
Sq Ft
$86/Sq Ft
Est. Value
About This Home
This home is located at 2319 Traymore Place, Columbus, OH 43211 and is currently priced at $85,991, approximately $85 per square foot. 2319 Traymore Place is a home located in Franklin County with nearby schools including Linden STEM Academy (K-6), Linden-Mckinley Stem School On Arcadia, and Focus Learning Academy of Central Columbus.
Ownership History
Date
Name
Owned For
Owner Type
Purchase Details
Closed on
Apr 24, 2020
Sold by
Central Ohio Community Improvement Corp
Bought by
City Of Columbus
Current Estimated Value
Purchase Details
Closed on
May 27, 2016
Sold by
City Of Columbus Ohio
Bought by
Central Ohio Community Improvement Corp
Purchase Details
Closed on
Feb 12, 2016
Sold by
Central Ohio Community Improvement Corp
Bought by
City Of Columbus Ohio
Purchase Details
Closed on
Sep 9, 2015
Sold by
Mingo Clarence E
Bought by
Central Ohio Community Improvement Corp
Purchase Details
Closed on
May 6, 2004
Sold by
Va
Bought by
Rivers Melode D
Purchase Details
Closed on
Sep 18, 2003
Sold by
Faris Michael G and Wells Fargo Home Mortgage Inc
Bought by
Hud
Purchase Details
Closed on
Jul 31, 1985
Bought by
Faris Michael G
Purchase Details
Closed on
Jan 1, 1985
Create a Home Valuation Report for This Property
The Home Valuation Report is an in-depth analysis detailing your home's value as well as a comparison with similar homes in the area
Home Values in the Area
Average Home Value in this Area
Purchase History
| Date | Buyer | Sale Price | Title Company |
|---|---|---|---|
| City Of Columbus | -- | None Available | |
| Central Ohio Community Improvement Corp | -- | None Available | |
| City Of Columbus Ohio | -- | Attorney | |
| Central Ohio Community Improvement Corp | -- | Attorney | |
| Rivers Melode D | -- | Fidelity Land Title Agency I | |
| Hud | $28,000 | J Wheeler | |
| Faris Michael G | $33,500 | -- | |
| -- | $500 | -- |
Source: Public Records
Tax History Compared to Growth
Tax History
| Year | Tax Paid | Tax Assessment Tax Assessment Total Assessment is a certain percentage of the fair market value that is determined by local assessors to be the total taxable value of land and additions on the property. | Land | Improvement |
|---|---|---|---|---|
| 2022 | $0 | $1,790 | $1,790 | $0 |
| 2021 | $0 | $1,790 | $1,790 | $0 |
| 2020 | $0 | $1,790 | $1,790 | $0 |
| 2019 | $0 | $1,580 | $1,580 | $0 |
| 2018 | $0 | $1,580 | $1,580 | $0 |
| 2017 | $0 | $1,580 | $1,580 | $0 |
| 2016 | $611 | $10,150 | $2,310 | $7,840 |
| 2015 | -- | $10,150 | $2,310 | $7,840 |
| 2014 | $612 | $10,150 | $2,310 | $7,840 |
| 2013 | $665 | $11,970 | $2,730 | $9,240 |
Source: Public Records
Map
Nearby Homes
- 1799 Harold Place
- 1864 E Hudson St
- 2444 Bancroft St
- 1614 Republic Ave
- 1938 Myrtle Ave
- 1625 Kenmore Rd
- 1609 Arlington Ave
- 1566 Briarwood Ave
- 00 Minnesota Ave
- 01 Minnesota Ave
- 1326 Minnesota Ave
- 1527 E Hudson St
- 1519 E Hudson St
- 1544 Briarwood Ave
- 0 Parkwood Ave
- 1576 Arlington Ave Unit 578
- 1564-1566 E Blake Ave
- 1546 Myrtle Ave
- 1975 Mock Rd
- 2040 Loretta Ave
- 2325 Traymore Place
- 2313 Traymore Place
- 1757 Republic Ave
- 2331 Traymore Place
- 2307 Traymore Place
- 1751 Republic Ave
- 2301 Traymore Place
- 2322 Bancroft St
- 2316 Bancroft St
- 2318 Traymore Place
- 1745 Republic Ave
- 2322 Traymore Place
- 2312 Traymore Place
- 2328 Traymore Place
- 2306 Traymore Place
- 2295 Traymore Place
- 1770 Republic Ave
- 1762 Republic Ave
- 2298 Traymore Place