232 18th St Findlay, OH 45840
Estimated Value: $145,000 - $195,000
3
Beds
2
Baths
1,208
Sq Ft
$142/Sq Ft
Est. Value
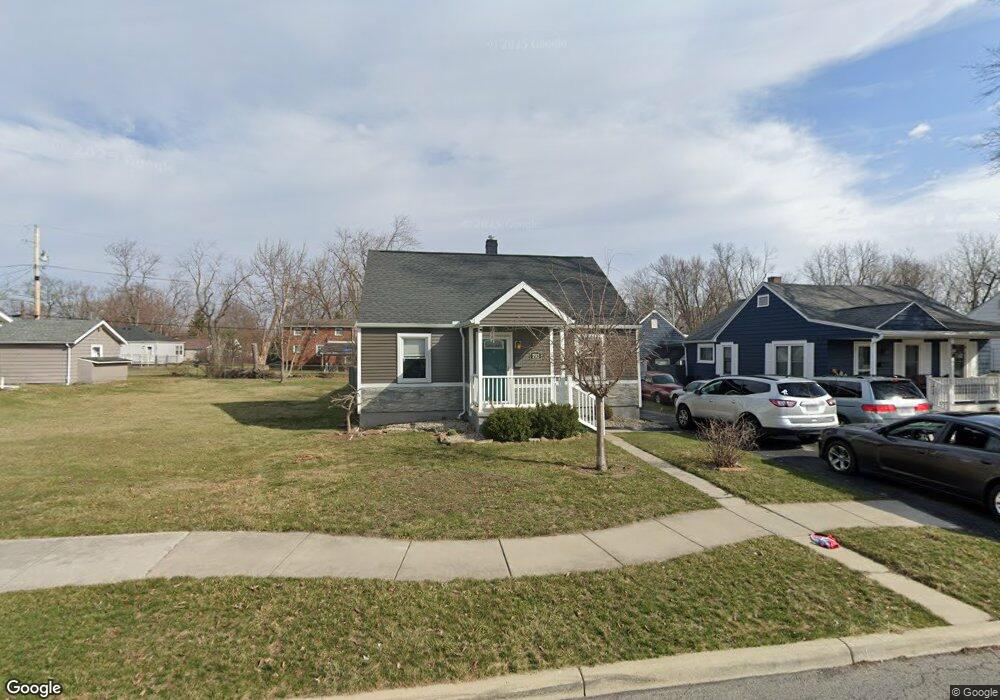
About This Home
This home is located at 232 18th St, Findlay, OH 45840 and is currently estimated at $171,458, approximately $141 per square foot. 232 18th St is a home located in Hancock County with nearby schools including Northview Elementary School, Bigelow Hill Elementary School, and Glenwood Middle School.
Ownership History
Date
Name
Owned For
Owner Type
Purchase Details
Closed on
Sep 20, 2021
Sold by
Richards Chad M and Richards Janna L
Bought by
Risser Tobias and Risser Tenna
Current Estimated Value
Home Financials for this Owner
Home Financials are based on the most recent Mortgage that was taken out on this home.
Original Mortgage
$137,464
Outstanding Balance
$125,082
Interest Rate
2.8%
Mortgage Type
FHA
Estimated Equity
$46,376
Purchase Details
Closed on
Sep 6, 1995
Sold by
Moser Lavern
Bought by
Richards Chad
Home Financials for this Owner
Home Financials are based on the most recent Mortgage that was taken out on this home.
Original Mortgage
$58,947
Interest Rate
7.76%
Mortgage Type
FHA
Purchase Details
Closed on
Mar 18, 1991
Bought by
Moser Lavern K
Purchase Details
Closed on
Aug 1, 1983
Bought by
Kuhlman Dennis L and Kuhlman Deborah
Create a Home Valuation Report for This Property
The Home Valuation Report is an in-depth analysis detailing your home's value as well as a comparison with similar homes in the area
Home Values in the Area
Average Home Value in this Area
Purchase History
| Date | Buyer | Sale Price | Title Company |
|---|---|---|---|
| Risser Tobias | $140,000 | Assured Title Agency | |
| Richards Chad | $62,500 | -- | |
| Moser Lavern K | $44,300 | -- | |
| Kuhlman Dennis L | $40,000 | -- |
Source: Public Records
Mortgage History
| Date | Status | Borrower | Loan Amount |
|---|---|---|---|
| Open | Risser Tobias | $137,464 | |
| Previous Owner | Richards Chad | $58,947 |
Source: Public Records
Tax History
| Year | Tax Paid | Tax Assessment Tax Assessment Total Assessment is a certain percentage of the fair market value that is determined by local assessors to be the total taxable value of land and additions on the property. | Land | Improvement |
|---|---|---|---|---|
| 2024 | $1,478 | $41,620 | $4,280 | $37,340 |
| 2023 | $1,481 | $41,620 | $4,280 | $37,340 |
| 2022 | $1,476 | $41,620 | $4,280 | $37,340 |
| 2021 | $1,290 | $31,700 | $4,290 | $27,410 |
| 2020 | $1,290 | $31,700 | $4,290 | $27,410 |
| 2019 | $1,264 | $31,700 | $4,290 | $27,410 |
| 2018 | $1,203 | $27,680 | $3,730 | $23,950 |
| 2017 | $1,204 | $27,680 | $3,730 | $23,950 |
| 2016 | $1,195 | $27,680 | $3,730 | $23,950 |
| 2015 | $1,107 | $25,310 | $3,430 | $21,880 |
| 2014 | $1,107 | $25,310 | $3,430 | $21,880 |
| 2012 | $1,115 | $25,310 | $3,430 | $21,880 |
Source: Public Records
Map
Nearby Homes
- 1820 Gayle Ln
- 146 Clifton Ave
- 140 Monroe Ave
- 145 Madison Ave
- 301 Allen Ave
- 232 Prentiss Ave
- 206 Midland Ave
- 322 Midland Ave
- 241 Stanley Ave
- 239 Edith Ave
- 315 W Melrose Ave
- 329 W Melrose Ave
- 421 Clifton Ave
- 2400 Hollybrook Dr
- 2604 N Main St
- 204 Laquineo St
- 0 E Melrose Ave
- 128 Harrington Ave
- 528 Rector Ave
- 0 Sheridan Ave
Your Personal Tour Guide
Ask me questions while you tour the home.