Estimated Value: $331,000 - $371,000
About This Home
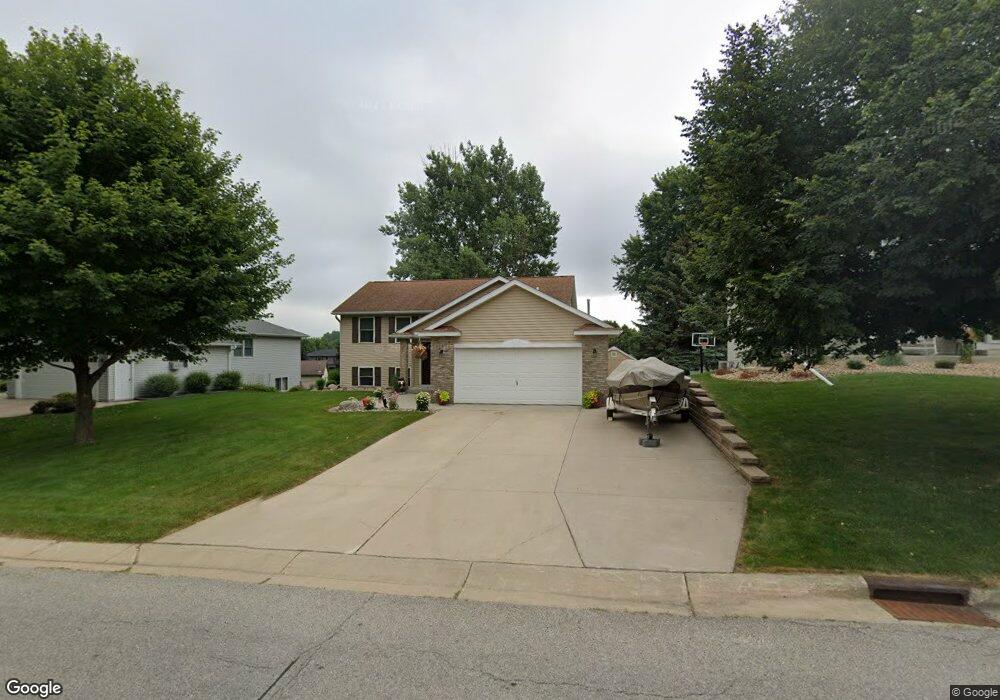
This home is located at 232 9th St NE, Byron, MN 55920 and is currently estimated at $355,495, approximately $161 per square foot. 232 9th St NE is a home located in Olmsted County with nearby schools including Byron Intermediate School, Byron Middle School, and Byron Senior High School.
Ownership History
We collect this data history from publicly available records. To have your information removed, we recommend requesting removal directly through your county’s website.
Purchase Details
Home Financials for this Owner
Home Financials are based on the most recent Mortgage that was taken out on this home.Home Values in the Area
Average Home Value in this Area
Purchase History
We collect this data history from publicly available records. To have your information removed, we recommend requesting removal directly through your county’s website.
| Date | Buyer | Sale Price | Title Company |
|---|---|---|---|
| $267,900 | Trademark Title Services Inc | ||
| $267,900 | -- |
Mortgage History
We collect this data history from publicly available records. To have your information removed, we recommend requesting removal directly through your county’s website.
| Date | Status | Borrower | Loan Amount |
|---|---|---|---|
| Previous Owner | $254,505 | ||
| Closed | $254,505 |
Tax History
We collect this data history from publicly available records. To have your information removed, we recommend requesting removal directly through your county’s website.
| Year | Tax Paid | Tax Assessment Tax Assessment Total Assessment is a certain percentage of the fair market value that is determined by local assessors to be the total taxable value of land and additions on the property. | Land | Improvement |
|---|---|---|---|---|
| 2024 | $4,532 | $298,200 | $45,000 | $253,200 |
| 2023 | $4,438 | $290,800 | $40,000 | $250,800 |
| 2022 | $4,026 | $276,700 | $40,000 | $236,700 |
| 2021 | $3,452 | $234,200 | $40,000 | $194,200 |
| 2020 | $3,354 | $216,400 | $40,000 | $176,400 |
| 2019 | $3,234 | $206,500 | $35,000 | $171,500 |
| 2018 | $2,601 | $198,800 | $30,000 | $168,800 |
| 2017 | $2,524 | $167,300 | $30,000 | $137,300 |
| 2016 | $2,290 | $139,900 | $21,700 | $118,200 |
| 2015 | $2,264 | $123,500 | $21,100 | $102,400 |
| 2014 | $2,050 | $124,900 | $21,200 | $103,700 |
| 2012 | -- | $124,600 | $21,144 | $103,456 |
Map
- 655 Somerby Pkwy NE
- 578 Somerby Pkwy NE
- 595 Somerby Pkwy NE
- 667 Somerby Pkwy NE
- 675 Somerby Pkwy NE
- 843 Somerby Pkwy NE
- 827 Somerby Pkwy NE
- 498 Somerby Pkwy NE
- 638 Shardlow Place NE
- 1046 Maplebeck Place NE
- 720 Somerby Pkwy NE
- 755 Somerby Pkwy NE
- 1406 Epperstone Enclave NE
- 623 7th Ave NE
- 631 7th Ave NE
- 785 Somerby Pkwy NE
- 1326 Falstone Alcove NE
- 813 Bridgeford Place NE
- 927 Southwell Enclave NE
- 817 Bridgeford Place NE
Ask me questions while you tour the home.