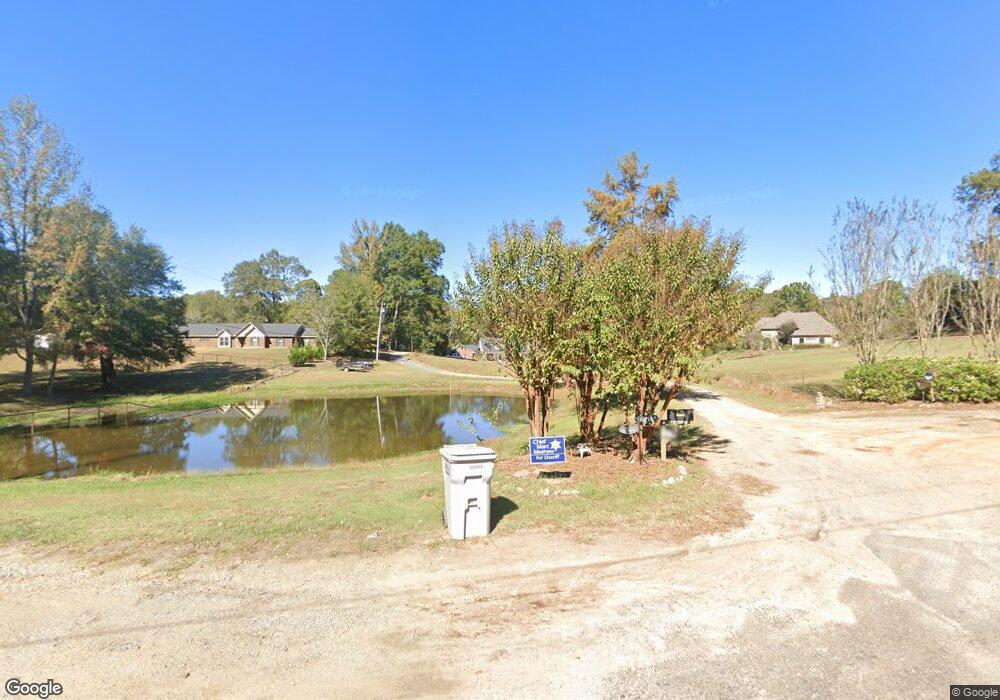
232 Barnard Rd West Monroe, LA 71291
Estimated Value: $395,000 - $494,456
4
Beds
3
Baths
3,375
Sq Ft
$136/Sq Ft
Est. Value
About This Home
This home is located at 232 Barnard Rd, West Monroe, LA 71291 and is currently estimated at $458,614, approximately $135 per square foot. 232 Barnard Rd is a home located in Ouachita Parish with nearby schools including Drew Elementary School and West Monroe High School.
Ownership History
Date
Name
Owned For
Owner Type
Purchase Details
Closed on
Feb 27, 2024
Sold by
Fairbanks Development Llc
Bought by
Lowder Jackson James and Johnson Abigail Reed
Current Estimated Value
Purchase Details
Closed on
Mar 24, 2014
Sold by
Barnard James Leman and Barnard Lorraine O Rear
Bought by
Barnard Robert Brian and Barnard Lonetta Buff
Purchase Details
Closed on
Jul 19, 2013
Sold by
Barnard Jason A and Brown Barnard Christina Marie
Bought by
Barnard James Leman and Barnard Lorraine O Rear
Home Financials for this Owner
Home Financials are based on the most recent Mortgage that was taken out on this home.
Original Mortgage
$50,000,000
Interest Rate
3.94%
Mortgage Type
Credit Line Revolving
Create a Home Valuation Report for This Property
The Home Valuation Report is an in-depth analysis detailing your home's value as well as a comparison with similar homes in the area
Home Values in the Area
Average Home Value in this Area
Purchase History
| Date | Buyer | Sale Price | Title Company |
|---|---|---|---|
| Lowder Jackson James | $160,000 | None Listed On Document | |
| Barnard Robert Brian | $285,000 | None Available | |
| Barnard James Leman | $300,000 | None Available |
Source: Public Records
Mortgage History
| Date | Status | Borrower | Loan Amount |
|---|---|---|---|
| Previous Owner | Barnard James Leman | $50,000,000 |
Source: Public Records
Tax History Compared to Growth
Tax History
| Year | Tax Paid | Tax Assessment Tax Assessment Total Assessment is a certain percentage of the fair market value that is determined by local assessors to be the total taxable value of land and additions on the property. | Land | Improvement |
|---|---|---|---|---|
| 2024 | $2,718 | $37,076 | $3,255 | $33,821 |
| 2023 | $2,718 | $30,064 | $3,255 | $26,809 |
| 2022 | $2,673 | $30,064 | $3,255 | $26,809 |
| 2021 | $2,707 | $30,136 | $3,255 | $26,881 |
| 2020 | $2,731 | $30,409 | $3,255 | $27,154 |
| 2019 | $2,567 | $28,666 | $2,255 | $26,411 |
| 2018 | $1,896 | $28,666 | $2,255 | $26,411 |
| 2017 | $2,567 | $28,591 | $2,255 | $26,336 |
| 2016 | $2,566 | $22,482 | $2,343 | $20,139 |
| 2015 | $1,338 | $22,482 | $2,343 | $20,139 |
| 2014 | $1,338 | $22,482 | $2,343 | $20,139 |
| 2013 | $1,334 | $22,482 | $2,343 | $20,139 |
Source: Public Records
Map
Nearby Homes
- 171 Chimney Hill Rd
- 158 Rex Robertson Rd
- 000 Strozier Rd
- 108 Comanche Trail
- 201 Glen Acres Rd
- 149 Comanche Trail
- 0 (A) Carter Rd
- 0 (B) Carter Rd
- 000 C Carter Rd
- 159 Chapel Ln
- 107 Sioux Dr
- 100 Aspen Cir
- 205 Chapel Hill Place
- 110 Fox Run Unit 110 Fox run
- 000 J T Griggs Rd Unit 454 J T Griggs Road
- 00 J T Griggs Rd Unit 454 J T Griggs Road
- 454 J T Griggs Rd
- 0 J T Griggs Rd Unit 454 J T Griggs Road
- 0 Bonnabel Place
- 107 Bonnabel Place
- 248 Barnard Rd
- 222 Barnard Rd
- 216 Barnard Rd
- 249 Barnard Rd
- 199 Barnard Rd
- 192 Barnard Rd
- 193 Barnard Rd
- 189 Barnard Rd
- 146 Bonnie Brook Dr
- 250 Preston Rd
- 136 Bonnie Brook Dr
- 166 Bonnie Brook Dr
- 132 Barnard Rd
- 240 Preston Rd
- 304 Chimney Hill Rd
- 165 Bonnie Brook Dr
- 115 Barnard Rd
- 253 Chimney Hill Rd
- 208 Preston Rd
- 348 Gilliland Rd