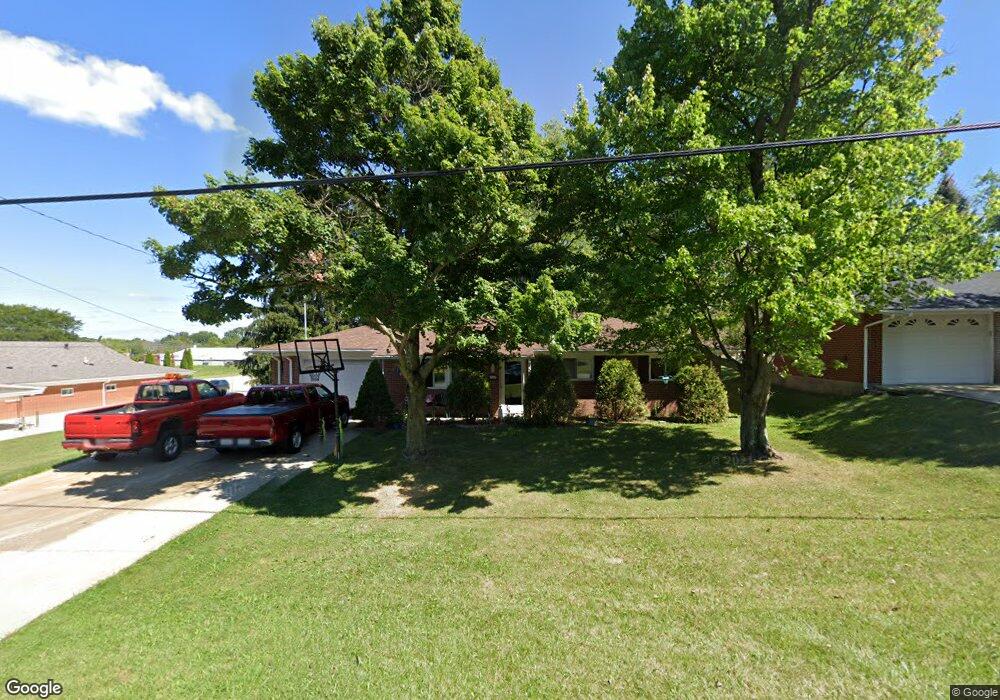
232 Brookwood Way N Mansfield, OH 44906
Estimated Value: $113,000 - $154,000
3
Beds
2
Baths
1,040
Sq Ft
$123/Sq Ft
Est. Value
About This Home
This home is located at 232 Brookwood Way N, Mansfield, OH 44906 and is currently estimated at $127,890, approximately $122 per square foot. 232 Brookwood Way N is a home located in Richland County with nearby schools including The Richland School of Academic Arts, Mansfield Elective Academy, and Goal Digital Academy.
Ownership History
Date
Name
Owned For
Owner Type
Purchase Details
Closed on
May 18, 2010
Sold by
Federal Home Loan Mortgage Corporation
Bought by
Stimens Kurt and Kurt Stimens Revocable Living Trust
Current Estimated Value
Purchase Details
Closed on
Apr 20, 2010
Sold by
Christus Amy N
Bought by
Federal Home Loan Mortgage Corp
Purchase Details
Closed on
Nov 25, 2002
Sold by
Perry Gary E
Bought by
Christus Amy N
Home Financials for this Owner
Home Financials are based on the most recent Mortgage that was taken out on this home.
Original Mortgage
$79,748
Interest Rate
6.08%
Mortgage Type
FHA
Purchase Details
Closed on
Nov 13, 2001
Sold by
Bank One Na
Bought by
Perry Gary E
Home Financials for this Owner
Home Financials are based on the most recent Mortgage that was taken out on this home.
Original Mortgage
$48,800
Interest Rate
5.5%
Mortgage Type
New Conventional
Purchase Details
Closed on
Mar 19, 1993
Sold by
Gordon Bernard
Bought by
Gordon Bernard
Create a Home Valuation Report for This Property
The Home Valuation Report is an in-depth analysis detailing your home's value as well as a comparison with similar homes in the area
Home Values in the Area
Average Home Value in this Area
Purchase History
| Date | Buyer | Sale Price | Title Company |
|---|---|---|---|
| Stimens Kurt | $27,000 | Southern Title | |
| Federal Home Loan Mortgage Corp | $30,000 | None Available | |
| Christus Amy N | $81,000 | -- | |
| Perry Gary E | $62,000 | -- | |
| Gordon Bernard | -- | -- |
Source: Public Records
Mortgage History
| Date | Status | Borrower | Loan Amount |
|---|---|---|---|
| Previous Owner | Christus Amy N | $79,748 | |
| Previous Owner | Perry Gary E | $48,800 |
Source: Public Records
Tax History Compared to Growth
Tax History
| Year | Tax Paid | Tax Assessment Tax Assessment Total Assessment is a certain percentage of the fair market value that is determined by local assessors to be the total taxable value of land and additions on the property. | Land | Improvement |
|---|---|---|---|---|
| 2024 | $904 | $18,880 | $4,360 | $14,520 |
| 2023 | $904 | $18,880 | $4,360 | $14,520 |
| 2022 | $841 | $14,730 | $3,970 | $10,760 |
| 2021 | $847 | $14,730 | $3,970 | $10,760 |
| 2020 | $867 | $14,730 | $3,970 | $10,760 |
| 2019 | $961 | $14,730 | $3,970 | $10,760 |
| 2018 | $926 | $14,730 | $3,970 | $10,760 |
| 2017 | $1,001 | $20,830 | $3,970 | $16,860 |
| 2016 | $728 | $11,530 | $6,450 | $5,080 |
| 2015 | $695 | $11,530 | $6,450 | $5,080 |
| 2014 | $686 | $11,530 | $6,450 | $5,080 |
| 2012 | $261 | $11,530 | $6,450 | $5,080 |
Source: Public Records
Map
Nearby Homes
- 147 Wimbledon Dr
- 2585 Deerfield Ln
- 1431 Silver Ln
- 1496 W 4th St
- 143 Buckeye Ave
- 340 Boston Ave
- 0 W Fourth St - Trimble Lenox
- 720 Lindaire Ln E
- 142 Grasmere Ave
- 1694 Scarlett's Way
- 99 Scotland Blvd
- 175 Maple Ln
- 37 S Linden Rd
- 143 Kingwood Place
- 216 S Trimble Rd Unit 218
- 1068 Linwood Place
- 129 Ludwig Dr
- 232 S Trimble Rd Unit 234
- 244 S Trimble Rd Unit 246
- 190 S Linden Rd
- 228 Brookwood Way N
- 227 Lasalle St
- 218 Brookwood Way N
- 219 Lasalle St
- 215 Lasalle St
- 210 Brookwood Way N
- 209 Lasalle St
- 213 Brookwood Way N
- 224 Lasalle St
- 204 Brookwood Way N
- 205 Brookwood Way N
- 203 Lasalle St
- 214 Lasalle St
- 197 Lasalle St
- 199 Brookwood Way N
- 196 Brookwood Way N
- 191 Lasalle St
- 204 Lasalle St
- 204 Lasalle St
- 184 Brookwood Way N