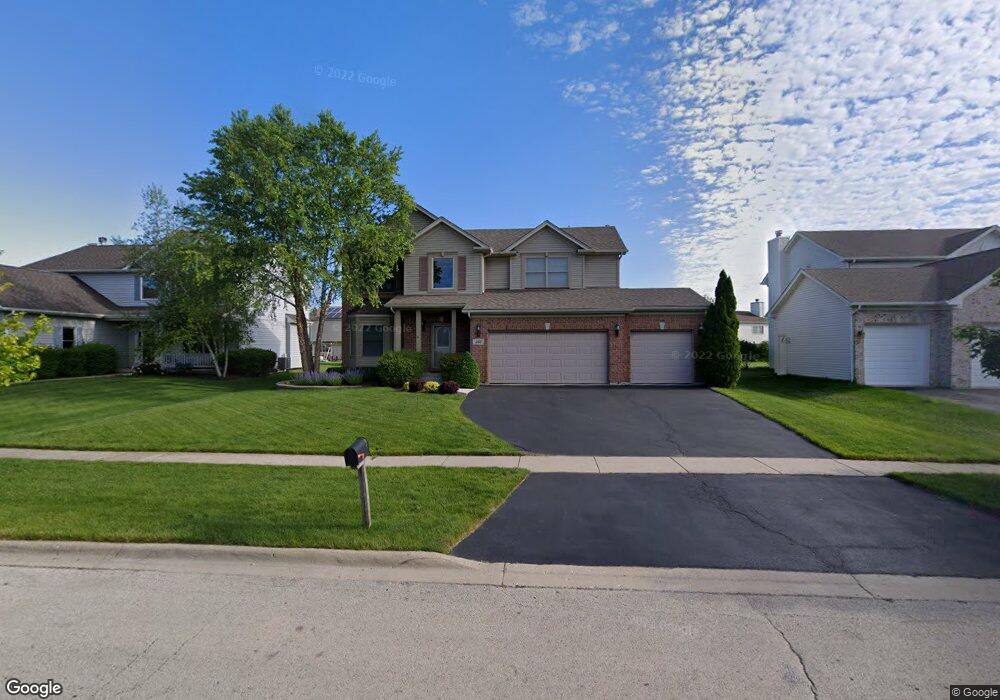
232 Cascade Dr Crystal Lake, IL 60012
Estimated Value: $432,000 - $443,761
4
Beds
5
Baths
2,292
Sq Ft
$191/Sq Ft
Est. Value
About This Home
This home is located at 232 Cascade Dr, Crystal Lake, IL 60012 and is currently estimated at $438,190, approximately $191 per square foot. 232 Cascade Dr is a home located in McHenry County with nearby schools including North Elementary School, Hannah Beardsley Middle School, and Prairie Ridge High School.
Ownership History
Date
Name
Owned For
Owner Type
Purchase Details
Closed on
Nov 22, 2006
Sold by
Stetz Scott E and Stetz Lisa M
Bought by
Swiatowy Jeffrey and Swiatowy Shirley S
Current Estimated Value
Home Financials for this Owner
Home Financials are based on the most recent Mortgage that was taken out on this home.
Original Mortgage
$235,900
Outstanding Balance
$144,650
Interest Rate
6.87%
Mortgage Type
Unknown
Estimated Equity
$293,540
Purchase Details
Closed on
Jan 15, 2003
Sold by
Darnell Eugene
Bought by
Stetz Scott E and Stetz Lisa M
Home Financials for this Owner
Home Financials are based on the most recent Mortgage that was taken out on this home.
Original Mortgage
$262,260
Interest Rate
6.3%
Purchase Details
Closed on
Mar 26, 2002
Sold by
Childers Christopher
Bought by
Darnell Eugene
Purchase Details
Closed on
Mar 12, 2002
Sold by
Harris Trust & Svgs Bank
Bought by
Childers Christopher and Darnell Eugene
Create a Home Valuation Report for This Property
The Home Valuation Report is an in-depth analysis detailing your home's value as well as a comparison with similar homes in the area
Home Values in the Area
Average Home Value in this Area
Purchase History
| Date | Buyer | Sale Price | Title Company |
|---|---|---|---|
| Swiatowy Jeffrey | $337,000 | Heritage Title Company | |
| Stetz Scott E | $282,000 | Chicago Title | |
| Darnell Eugene | -- | -- | |
| Childers Christopher | $52,000 | -- |
Source: Public Records
Mortgage History
| Date | Status | Borrower | Loan Amount |
|---|---|---|---|
| Open | Swiatowy Jeffrey | $235,900 | |
| Previous Owner | Stetz Scott E | $262,260 |
Source: Public Records
Tax History
| Year | Tax Paid | Tax Assessment Tax Assessment Total Assessment is a certain percentage of the fair market value that is determined by local assessors to be the total taxable value of land and additions on the property. | Land | Improvement |
|---|---|---|---|---|
| 2024 | $9,617 | $120,257 | $24,217 | $96,040 |
| 2023 | $9,311 | $107,844 | $21,717 | $86,127 |
| 2022 | $9,972 | $109,849 | $21,719 | $88,130 |
| 2021 | $9,176 | $102,990 | $20,363 | $82,627 |
| 2020 | $9,004 | $99,903 | $19,753 | $80,150 |
| 2019 | $8,716 | $94,983 | $18,780 | $76,203 |
| 2018 | $9,135 | $97,208 | $17,640 | $79,568 |
| 2017 | $9,244 | $90,336 | $16,900 | $73,436 |
| 2016 | $9,168 | $86,190 | $16,124 | $70,066 |
| 2013 | -- | $83,829 | $15,345 | $68,484 |
Source: Public Records
Map
Nearby Homes
- 255 Midlane Dr
- 570 Larium Ln
- 4908 Tile Line Rd
- 350 Crystal Ridge Dr Unit 350
- 4911 Redbird Ln
- 6315 Walkup Ln
- 6610 W Hillside Rd
- 9610 Illinois 176
- 227 2nd St
- 406 Ridge Ave
- 15 W Woodstock St
- 306 Lorraine Dr
- 186 Illinois St
- 4511 Hanover Dr
- 4507 Hanover Dr
- 121 Pomeroy Ave
- 191 S Virginia St
- 121 S Walkup Ave
- 133 S Walkup Ave
- 0 Millennium Dr
Your Personal Tour Guide
Ask me questions while you tour the home.