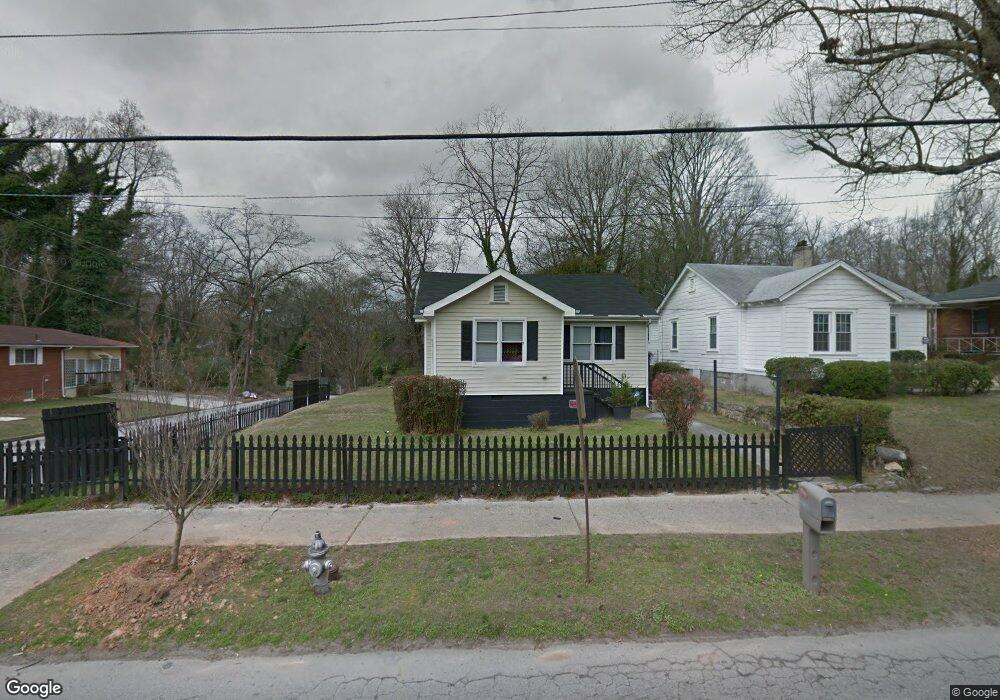
232 Chappell Rd NW Atlanta, GA 30314
Hunter Hills NeighborhoodEstimated Value: $191,644 - $287,000
3
Beds
2
Baths
956
Sq Ft
$252/Sq Ft
Est. Value
About This Home
This home is located at 232 Chappell Rd NW, Atlanta, GA 30314 and is currently estimated at $240,661, approximately $251 per square foot. 232 Chappell Rd NW is a home located in Fulton County with nearby schools including F.L. Stanton Elementary School, John Lewis Invictus Academy, and Frederick Douglass High School.
Ownership History
Date
Name
Owned For
Owner Type
Purchase Details
Closed on
Jan 31, 2022
Sold by
Kavuma Stanley
Bought by
Sustain Georgia Lp
Current Estimated Value
Purchase Details
Closed on
Nov 2, 2021
Sold by
Bruster Sherman
Bought by
Kavuma Stanley
Purchase Details
Closed on
Sep 5, 2008
Sold by
Burt Family Investments Llc
Bought by
Bruster Sherman
Home Financials for this Owner
Home Financials are based on the most recent Mortgage that was taken out on this home.
Original Mortgage
$40,000
Interest Rate
6.32%
Purchase Details
Closed on
Aug 13, 2008
Sold by
Bear Stearns I Llc 2007 & Ac6
Bought by
Burt Family Investments Llc
Home Financials for this Owner
Home Financials are based on the most recent Mortgage that was taken out on this home.
Original Mortgage
$40,000
Interest Rate
6.32%
Purchase Details
Closed on
May 6, 2008
Sold by
Moore Julie
Bought by
Bear Stearns I Llc 2007 & Ac6
Purchase Details
Closed on
Sep 27, 2006
Sold by
Davis Nathaniel
Bought by
Moore Julie
Home Financials for this Owner
Home Financials are based on the most recent Mortgage that was taken out on this home.
Original Mortgage
$194,750
Interest Rate
6.36%
Mortgage Type
New Conventional
Purchase Details
Closed on
Aug 23, 2005
Sold by
Abn Amro Mortgage Group
Bought by
Davis Nathaniel
Home Financials for this Owner
Home Financials are based on the most recent Mortgage that was taken out on this home.
Original Mortgage
$89,100
Interest Rate
5.84%
Mortgage Type
New Conventional
Purchase Details
Closed on
Mar 16, 2005
Sold by
Federal Home Loan Mortgage Corporation
Bought by
Abn Amro Mortgage Group Inc
Home Financials for this Owner
Home Financials are based on the most recent Mortgage that was taken out on this home.
Original Mortgage
$89,100
Interest Rate
5.72%
Mortgage Type
New Conventional
Purchase Details
Closed on
Aug 3, 2004
Sold by
Abn Amro Mortgage Group Inc
Bought by
Federal Home Loan Mortgage Corporation
Purchase Details
Closed on
Nov 8, 2002
Sold by
Collins Sharon
Bought by
Thompson Carol
Home Financials for this Owner
Home Financials are based on the most recent Mortgage that was taken out on this home.
Original Mortgage
$175,750
Interest Rate
5.98%
Mortgage Type
New Conventional
Purchase Details
Closed on
Jan 13, 1998
Sold by
Pg One Capital Inc
Bought by
Collins Sharon
Home Financials for this Owner
Home Financials are based on the most recent Mortgage that was taken out on this home.
Original Mortgage
$45,000
Interest Rate
9.37%
Mortgage Type
New Conventional
Create a Home Valuation Report for This Property
The Home Valuation Report is an in-depth analysis detailing your home's value as well as a comparison with similar homes in the area
Home Values in the Area
Average Home Value in this Area
Purchase History
| Date | Buyer | Sale Price | Title Company |
|---|---|---|---|
| Sustain Georgia Lp | $235,000 | -- | |
| Kavuma Stanley | $167,601 | -- | |
| Kavuma Stanley | $167,601 | -- | |
| Bruster Sherman | $94,500 | -- | |
| Burt Family Investments Llc | $37,000 | -- | |
| Bear Stearns I Llc 2007 & Ac6 | $75,000 | -- | |
| Moore Julie | $205,000 | -- | |
| Davis Nathaniel | $99,000 | -- | |
| Abn Amro Mortgage Group Inc | -- | -- | |
| Federal Home Loan Mortgage Corporation | -- | -- | |
| Abn Amro Mortgage Group Inc | $181,683 | -- | |
| Thompson Carol | $185,000 | -- | |
| Collins Sharon | $60,000 | -- | |
| Pg One Capital Inc | $24,900 | -- | |
| Abound Investments Inc | $24,900 | -- |
Source: Public Records
Mortgage History
| Date | Status | Borrower | Loan Amount |
|---|---|---|---|
| Previous Owner | Burt Family Investments Llc | $40,000 | |
| Previous Owner | Moore Julie | $194,750 | |
| Previous Owner | Davis Nathaniel | $89,100 | |
| Previous Owner | Abn Amro Mortgage Group Inc | $89,100 | |
| Previous Owner | Thompson Carol | $175,750 | |
| Previous Owner | Abound Investments Inc | $45,000 |
Source: Public Records
Tax History Compared to Growth
Tax History
| Year | Tax Paid | Tax Assessment Tax Assessment Total Assessment is a certain percentage of the fair market value that is determined by local assessors to be the total taxable value of land and additions on the property. | Land | Improvement |
|---|---|---|---|---|
| 2025 | $2,216 | $69,480 | $21,880 | $47,600 |
| 2023 | $2,876 | $69,480 | $21,880 | $47,600 |
| 2022 | $2,517 | $62,200 | $11,640 | $50,560 |
| 2021 | $96 | $51,040 | $18,280 | $32,760 |
| 2020 | $68 | $36,080 | $8,360 | $27,720 |
| 2019 | $350 | $25,600 | $5,760 | $19,840 |
| 2018 | $24 | $12,720 | $2,640 | $10,080 |
| 2017 | $18 | $12,080 | $3,640 | $8,440 |
| 2016 | $18 | $12,080 | $3,640 | $8,440 |
| 2015 | $356 | $12,080 | $3,640 | $8,440 |
| 2014 | $8 | $6,640 | $1,840 | $4,800 |
Source: Public Records
Map
Nearby Homes
- 1417 Lavender Dr NW
- 1416 Hawkins St NW
- 1427 Andrews St NW
- 1437 Andrews St NW
- 1451 Andrews St NW
- 1431 Andrews St NW
- 184 Scott St NW
- 1445 Hawkins St NW
- 1335 Andrews St NW
- 1466 Andrews St NW
- 0 Joseph E Boone St Unit 10608922
- 218 Childs Dr NW
- 288 Childs Dr NW
- 224 Childs Dr NW
- 228 Childs Dr NW
- 149 Edwards St NW
- 1482 Andrews St NW
- 235 Holly Rd NW
- 2053 Joseph E Boone Blvd NW
- 236 Chappell Rd NW
- 1411 Lavender Dr NW
- 240 Chappell Rd NW
- 218 Chappell Rd NW
- 250 Chappell Rd NW
- 231 Chappell Rd NW
- 1421 Lavender Dr NW
- 1410 Hawkins St NW
- 227 Chappell Rd NW
- 235 Chappell Rd NW
- 208 Chappell Rd NW
- 1414 Lavender Dr NW
- 241 Chappell Rd NW
- 221 Chappell Rd NW
- 217 Chappell Rd NW
- 1427 Lavender Dr NW
- 249 Chappell Rd NW
- 1418 Lavender Dr NW
- 200 Chappell Rd NW
- 247 Chappell Rd NW