Estimated Value: $346,000 - $399,000
3
Beds
3
Baths
2,747
Sq Ft
$136/Sq Ft
Est. Value
About This Home
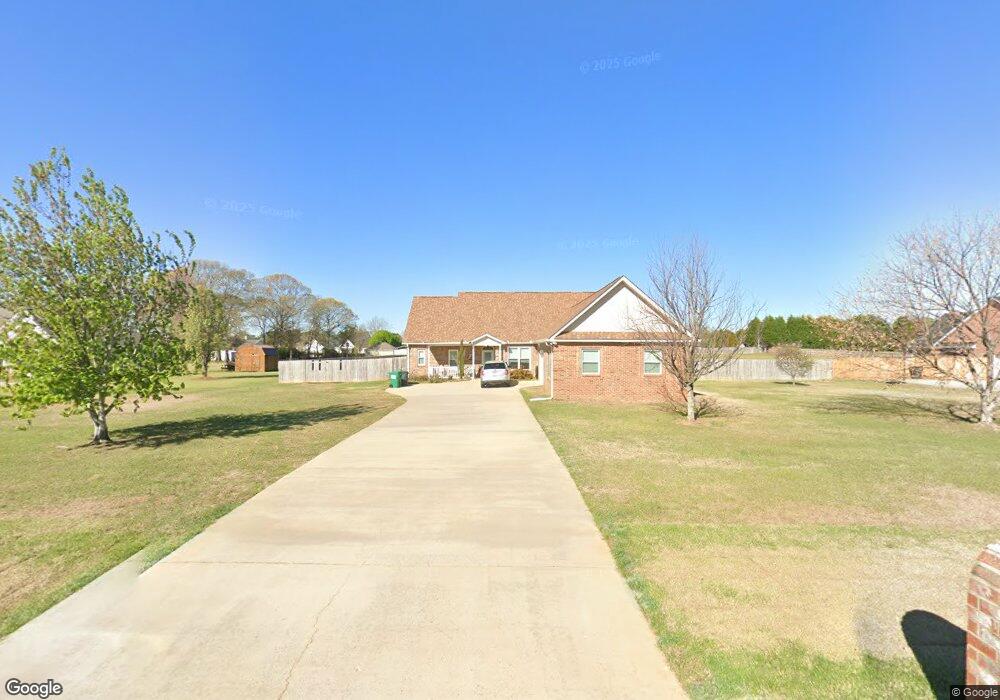
This home is located at 232 Cliett Rd, Byron, GA 31008 and is currently estimated at $374,623, approximately $136 per square foot. 232 Cliett Rd is a home located in Peach County with nearby schools including Kay Road Elementary School, Fort Valley Middle School, and Peach County High School.
Ownership History
Date
Name
Owned For
Owner Type
Purchase Details
Closed on
Apr 29, 2009
Sold by
Butler Robin P
Bought by
Bay Mishelle M
Current Estimated Value
Home Financials for this Owner
Home Financials are based on the most recent Mortgage that was taken out on this home.
Original Mortgage
$204,900
Outstanding Balance
$129,042
Interest Rate
4.79%
Mortgage Type
VA
Estimated Equity
$245,581
Purchase Details
Closed on
Oct 15, 2007
Sold by
Abacus Construction Llc
Bought by
Butler Robin P and Butler Michael C
Home Financials for this Owner
Home Financials are based on the most recent Mortgage that was taken out on this home.
Original Mortgage
$195,900
Interest Rate
6.26%
Mortgage Type
New Conventional
Purchase Details
Closed on
Dec 1, 2004
Sold by
United Bank Of Griffin
Bought by
Abacus Construction Llc
Purchase Details
Closed on
Apr 23, 2002
Bought by
United Bank Of Griffin
Create a Home Valuation Report for This Property
The Home Valuation Report is an in-depth analysis detailing your home's value as well as a comparison with similar homes in the area
Home Values in the Area
Average Home Value in this Area
Purchase History
| Date | Buyer | Sale Price | Title Company |
|---|---|---|---|
| Bay Mishelle M | $204,900 | -- | |
| Butler Robin P | $195,900 | -- | |
| Abacus Construction Llc | -- | -- | |
| United Bank Of Griffin | -- | -- |
Source: Public Records
Mortgage History
| Date | Status | Borrower | Loan Amount |
|---|---|---|---|
| Open | Bay Mishelle M | $204,900 | |
| Previous Owner | Butler Robin P | $195,900 |
Source: Public Records
Tax History Compared to Growth
Tax History
| Year | Tax Paid | Tax Assessment Tax Assessment Total Assessment is a certain percentage of the fair market value that is determined by local assessors to be the total taxable value of land and additions on the property. | Land | Improvement |
|---|---|---|---|---|
| 2024 | $3,687 | $132,520 | $10,520 | $122,000 |
| 2023 | $3,457 | $120,840 | $10,520 | $110,320 |
| 2022 | $2,988 | $103,400 | $10,520 | $92,880 |
| 2021 | $3,023 | $90,280 | $10,520 | $79,760 |
| 2020 | $2,643 | $78,120 | $10,520 | $67,600 |
| 2019 | $2,577 | $75,632 | $10,520 | $65,112 |
| 2018 | $2,589 | $75,632 | $10,520 | $65,112 |
| 2017 | $2,601 | $75,632 | $10,520 | $65,112 |
| 2016 | $2,591 | $75,632 | $10,520 | $65,112 |
| 2015 | $2,594 | $75,632 | $10,520 | $65,112 |
| 2014 | $2,598 | $75,632 | $10,520 | $65,112 |
| 2013 | -- | $76,472 | $11,360 | $65,112 |
Source: Public Records
Map
Nearby Homes
- 39 English Ct
- 165 Lakeview Rd
- 219 Rowland Cir
- 117 Hawks Ridge Trace
- 0 Barker Rd Unit 243030
- 0 Barker Rd Unit 14258525
- 0 Barker Rd Unit 175053
- 120 Hawks Place
- 127 Hawks Ridge Trace
- 120 Hawks Ridge Trace
- 107 Red Tail Cir
- 109 Red Tail Cir
- 152 Hawks Ridge Trace
- 108 Early Dr
- 199 Red Tail Cir
- 109 Early Dr
- 111 Early Dr
- 119 Early Dr
- 115 Early Dr
- 211 Serenity Ct