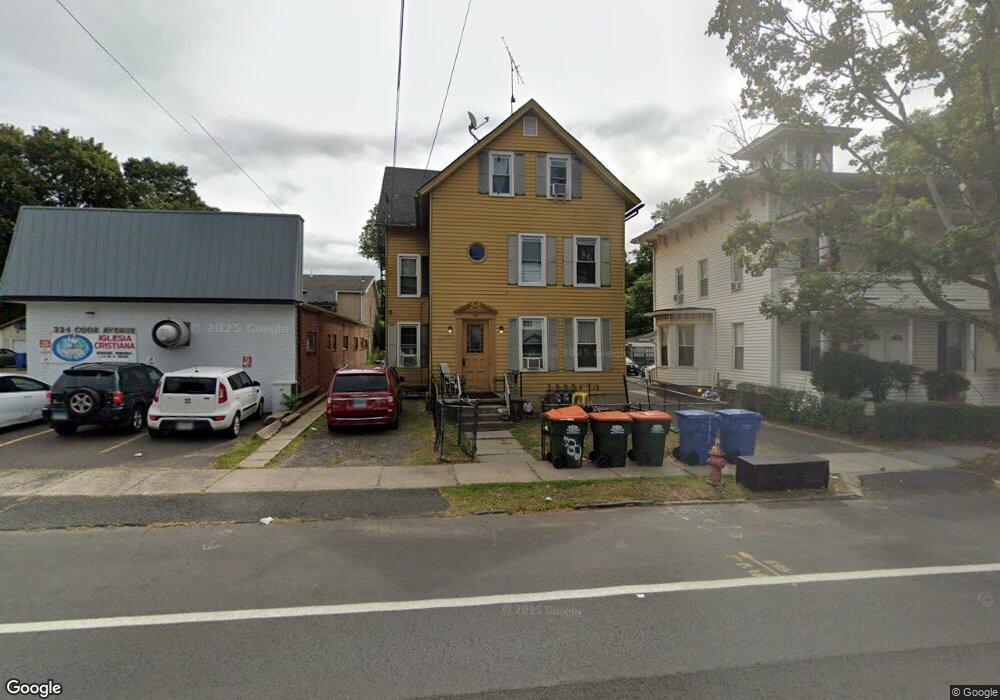
232 Cook Ave Meriden, CT 06451
Estimated Value: $131,416 - $334,000
4
Beds
1
Bath
2,785
Sq Ft
$80/Sq Ft
Est. Value
About This Home
This home is located at 232 Cook Ave, Meriden, CT 06451 and is currently estimated at $223,104, approximately $80 per square foot. 232 Cook Ave is a home located in New Haven County with nearby schools including Casimir Pulaski School, Lincoln Middle School, and Orville H. Platt High School.
Ownership History
Date
Name
Owned For
Owner Type
Purchase Details
Closed on
Dec 13, 2019
Sold by
Joseph Lucas
Bought by
Rubicon Realty Llc
Current Estimated Value
Purchase Details
Closed on
Feb 25, 2013
Sold by
Parded Props Llc
Bought by
Tahoe Realty Llc
Purchase Details
Closed on
Jul 3, 2012
Sold by
Strika Ivica S
Bought by
Isco Partners Llc
Purchase Details
Closed on
Feb 29, 2012
Sold by
Niland Lucy
Bought by
Strika Ivica
Purchase Details
Closed on
Jan 23, 2002
Sold by
Acorn Real Est Inv Llc
Bought by
Hassan Izzar and Hassan Ivette
Purchase Details
Closed on
Mar 23, 2001
Sold by
Mcdaniel William F and Mcdaniel Janice F
Bought by
Acorn Re Inv Llc
Create a Home Valuation Report for This Property
The Home Valuation Report is an in-depth analysis detailing your home's value as well as a comparison with similar homes in the area
Home Values in the Area
Average Home Value in this Area
Purchase History
| Date | Buyer | Sale Price | Title Company |
|---|---|---|---|
| Rubicon Realty Llc | -- | None Available | |
| Tahoe Realty Llc | $65,000 | -- | |
| Isco Partners Llc | -- | -- | |
| Strika Ivica | $81,500 | -- | |
| Hassan Izzar | $35,000 | -- | |
| Acorn Re Inv Llc | $17,500 | -- |
Source: Public Records
Tax History
| Year | Tax Paid | Tax Assessment Tax Assessment Total Assessment is a certain percentage of the fair market value that is determined by local assessors to be the total taxable value of land and additions on the property. | Land | Improvement |
|---|---|---|---|---|
| 2025 | $4,623 | $121,940 | $21,770 | $100,170 |
| 2024 | $4,696 | $121,940 | $21,770 | $100,170 |
| 2023 | $4,526 | $121,940 | $21,770 | $100,170 |
| 2022 | $4,270 | $121,940 | $21,770 | $100,170 |
| 2021 | $3,513 | $80,710 | $16,520 | $64,190 |
| 2020 | $3,504 | $80,710 | $16,520 | $64,190 |
| 2019 | $3,474 | $80,710 | $16,520 | $64,190 |
| 2018 | $3,487 | $80,710 | $16,520 | $64,190 |
| 2017 | $3,395 | $80,710 | $16,520 | $64,190 |
| 2016 | $4,032 | $101,570 | $28,490 | $73,080 |
| 2015 | $3,930 | $101,360 | $28,280 | $73,080 |
| 2014 | $3,834 | $101,360 | $28,280 | $73,080 |
Source: Public Records
Map
Nearby Homes
Your Personal Tour Guide
Ask me questions while you tour the home.