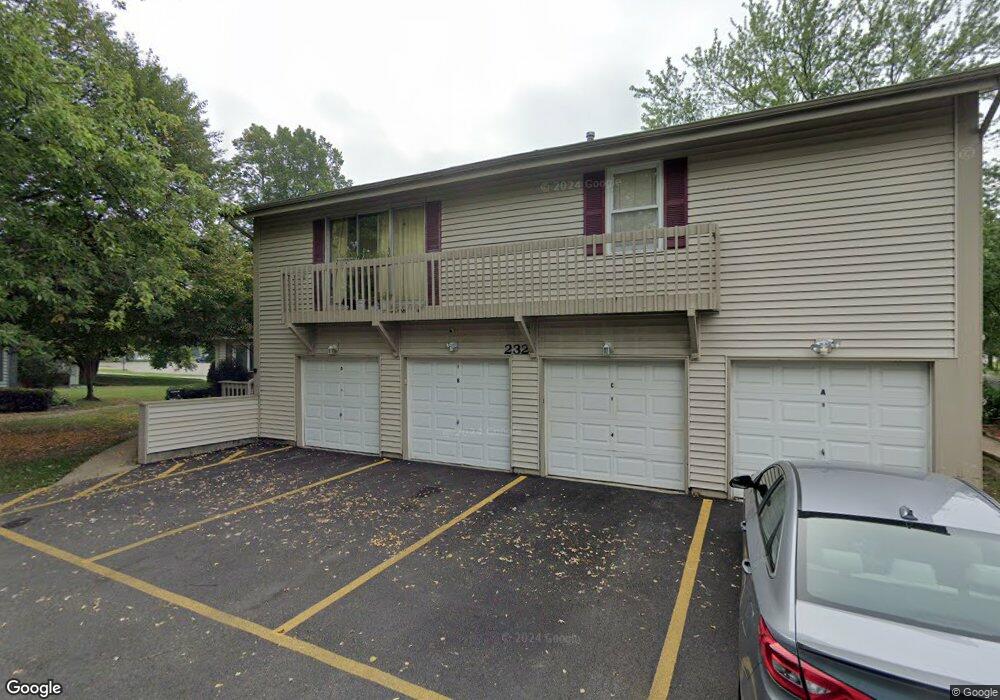
232 Dakota Ct Unit C Bolingbrook, IL 60440
East Bolingbrook NeighborhoodEstimated Value: $179,454 - $209,000
2
Beds
1
Bath
968
Sq Ft
$203/Sq Ft
Est. Value
About This Home
This home is located at 232 Dakota Ct Unit C, Bolingbrook, IL 60440 and is currently estimated at $196,114, approximately $202 per square foot. 232 Dakota Ct Unit C is a home located in Will County with nearby schools including Oak View Elementary School, Bolingbrook High School, and Midwest Christian Montessori Academy.
Ownership History
Date
Name
Owned For
Owner Type
Purchase Details
Closed on
Aug 9, 2006
Sold by
Hernandez Elias and Hernandez Araceli
Bought by
Hernandez Aurora and Hernandez Angelica
Current Estimated Value
Home Financials for this Owner
Home Financials are based on the most recent Mortgage that was taken out on this home.
Original Mortgage
$75,000
Interest Rate
6.49%
Mortgage Type
Purchase Money Mortgage
Purchase Details
Closed on
Oct 8, 2003
Sold by
Flores Hermelindo and Hernandez Elias
Bought by
Hernandez Elias and Gonzalez Araceli
Purchase Details
Closed on
Sep 24, 2001
Sold by
Flores Hermelindo
Bought by
Flores Hermelindo and Hernandez Elias
Home Financials for this Owner
Home Financials are based on the most recent Mortgage that was taken out on this home.
Original Mortgage
$61,944
Interest Rate
6.99%
Mortgage Type
FHA
Purchase Details
Closed on
Jan 29, 1995
Sold by
Flores Hector M
Bought by
Flores Hermelindo
Purchase Details
Closed on
Oct 17, 1991
Bought by
Hernandez Aurora
Create a Home Valuation Report for This Property
The Home Valuation Report is an in-depth analysis detailing your home's value as well as a comparison with similar homes in the area
Home Values in the Area
Average Home Value in this Area
Purchase History
| Date | Buyer | Sale Price | Title Company |
|---|---|---|---|
| Hernandez Aurora | -- | Stewart Title Company | |
| Hernandez Elias | -- | -- | |
| Flores Hermelindo | -- | Greater Illinois Title Compa | |
| Flores Hermelindo | -- | -- | |
| Hernandez Aurora | $72,500 | -- |
Source: Public Records
Mortgage History
| Date | Status | Borrower | Loan Amount |
|---|---|---|---|
| Previous Owner | Hernandez Aurora | $75,000 | |
| Previous Owner | Flores Hermelindo | $61,944 |
Source: Public Records
Tax History
| Year | Tax Paid | Tax Assessment Tax Assessment Total Assessment is a certain percentage of the fair market value that is determined by local assessors to be the total taxable value of land and additions on the property. | Land | Improvement |
|---|---|---|---|---|
| 2024 | $3,883 | $50,049 | $6,086 | $43,963 |
| 2023 | $3,883 | $45,032 | $5,476 | $39,556 |
| 2022 | $3,592 | $38,483 | $4,680 | $33,803 |
| 2021 | $2,913 | $34,934 | $4,249 | $30,685 |
| 2020 | $2,679 | $32,486 | $3,951 | $28,535 |
| 2019 | $2,450 | $29,749 | $3,618 | $26,131 |
| 2018 | $2,035 | $25,588 | $3,112 | $22,476 |
| 2017 | $1,913 | $24,254 | $2,950 | $21,304 |
| 2016 | $1,740 | $22,200 | $2,700 | $19,500 |
| 2015 | $1,698 | $21,300 | $2,600 | $18,700 |
| 2014 | $1,698 | $21,300 | $2,600 | $18,700 |
| 2013 | $1,698 | $21,300 | $2,600 | $18,700 |
Source: Public Records
Map
Nearby Homes
- 228 Elkhorn Ct Unit B
- 227 Elkhorn Ct Unit D
- 233 Seneca Ct
- 336 Ozark Dr
- 642 Sundance Dr
- 261 Bryant Way
- 662 Sundance Dr
- 265 Cobb Cir
- 118 Springleaf Dr Unit 5
- 4 Franklin Ct Unit 2
- VACANT W Boughton Rd
- 230 Delaware Dr
- 160 Galewood Dr
- 164 Galewood Dr
- 209 Mill Stream Dr
- 13 Marywood Ln Unit C
- 209 Bunker Hill Dr
- 226 Grant Dr
- 372 Windsong Ct Unit 4110
- 450 Lily Cache Ln
- 226 Cherokee Dr Unit C
- 226 Cherokee Dr Unit B
- 226 Cherokee Dr Unit A
- 226 Cherokee Dr Unit D
- 230 Dakota Ct Unit C
- 230 Dakota Ct Unit B
- 230 Dakota Ct Unit D
- 228 Dakota Ct Unit D
- 231 Dakota Ct Unit A
- 231 Dakota Ct Unit B
- 232 Dakota Ct Unit B
- 228 Dakota Ct Unit C
- 231 Dakota Ct Unit C
- 228 Dakota Ct Unit A
- 232 Dakota Ct Unit A
- 231 Dakota Ct Unit D
- 232 Dakota Ct Unit D
- 230 Dakota Ct Unit A
- 228 Dakota Ct Unit B
- 230 Dakota Ct
Your Personal Tour Guide
Ask me questions while you tour the home.