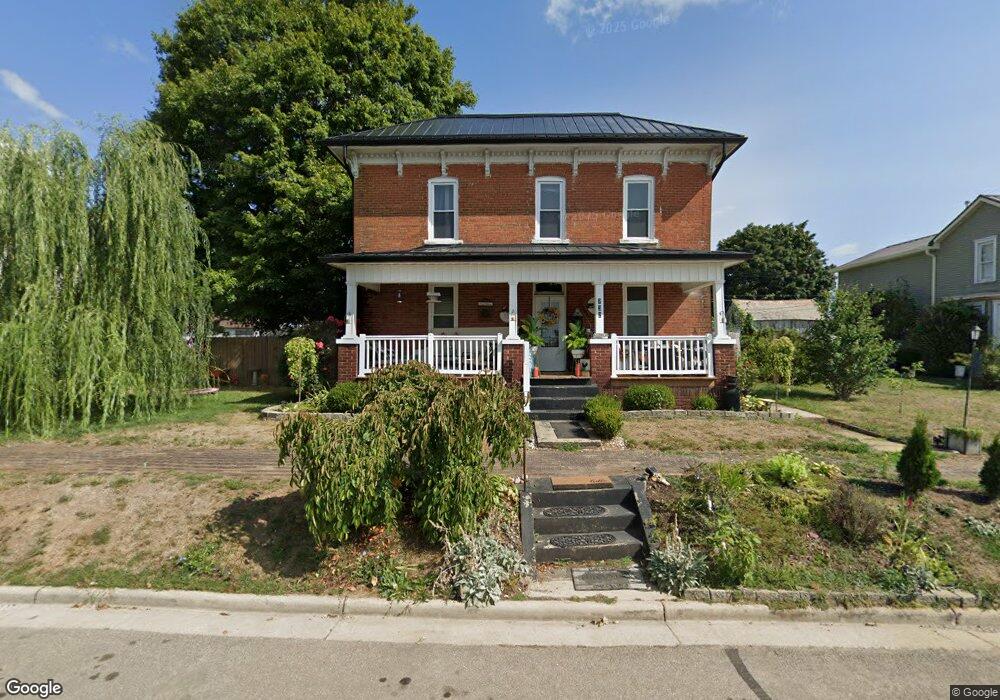
232 E Main St Amanda, OH 43102
Estimated Value: $220,000 - $303,000
3
Beds
1
Bath
1,755
Sq Ft
$153/Sq Ft
Est. Value
About This Home
This home is located at 232 E Main St, Amanda, OH 43102 and is currently estimated at $269,018, approximately $153 per square foot. 232 E Main St is a home located in Fairfield County with nearby schools including Amanda-Clearcreek Primary School, Amanda-Clearcreek Elementary School, and Amanda-Clearcreek Middle School.
Ownership History
Date
Name
Owned For
Owner Type
Purchase Details
Closed on
Aug 10, 2021
Sold by
Carter Elizabeth and The Etc Trust
Bought by
Peabody Michael
Current Estimated Value
Home Financials for this Owner
Home Financials are based on the most recent Mortgage that was taken out on this home.
Original Mortgage
$154,156
Outstanding Balance
$138,423
Interest Rate
2.8%
Mortgage Type
FHA
Estimated Equity
$130,595
Purchase Details
Closed on
Dec 29, 2015
Sold by
Reynolds Brandie
Bought by
Carter Elizabeth
Home Financials for this Owner
Home Financials are based on the most recent Mortgage that was taken out on this home.
Original Mortgage
$61,367
Interest Rate
5.5%
Mortgage Type
FHA
Purchase Details
Closed on
Mar 3, 2010
Sold by
White Linda G
Bought by
White Linda G
Purchase Details
Closed on
Feb 1, 1989
Bought by
White Linda G
Create a Home Valuation Report for This Property
The Home Valuation Report is an in-depth analysis detailing your home's value as well as a comparison with similar homes in the area
Purchase History
| Date | Buyer | Sale Price | Title Company |
|---|---|---|---|
| Peabody Michael | $157,000 | Great American Title Agency | |
| Carter Elizabeth | $62,500 | None Available | |
| White Linda G | -- | None Available | |
| White Linda G | $42,000 | -- |
Source: Public Records
Mortgage History
| Date | Status | Borrower | Loan Amount |
|---|---|---|---|
| Open | Peabody Michael | $154,156 | |
| Previous Owner | Carter Elizabeth | $61,367 |
Source: Public Records
Tax History
| Year | Tax Paid | Tax Assessment Tax Assessment Total Assessment is a certain percentage of the fair market value that is determined by local assessors to be the total taxable value of land and additions on the property. | Land | Improvement |
|---|---|---|---|---|
| 2025 | $4,470 | $99,010 | $18,430 | $80,580 |
| 2024 | $4,470 | $76,670 | $7,520 | $69,150 |
| 2023 | $2,547 | $76,670 | $7,520 | $69,150 |
| 2022 | $2,547 | $76,670 | $7,520 | $69,150 |
| 2021 | $1,794 | $49,420 | $7,520 | $41,900 |
| 2020 | $1,860 | $49,420 | $7,520 | $41,900 |
| 2019 | $1,867 | $49,420 | $7,520 | $41,900 |
| 2018 | $1,488 | $38,970 | $7,520 | $31,450 |
| 2017 | $1,490 | $38,530 | $7,520 | $31,010 |
| 2016 | $1,264 | $38,530 | $7,520 | $31,010 |
| 2015 | $1,018 | $37,110 | $7,520 | $29,590 |
| 2014 | $964 | $37,110 | $7,520 | $29,590 |
| 2013 | $964 | $37,110 | $7,520 | $29,590 |
Source: Public Records
Map
Nearby Homes
- 117 Church St
- 5974 Amanda Southern Rd SW
- 3228 Chillicothe Lancaster Rd SW
- 4640 Chillicothe Lancaster Rd SW
- 00 Duncan Rd SW
- 5445 S Duncan Rd SW
- 6615 Westfall Rd SW
- 8485 Westfall Rd SW
- 6532 Julian Rd SW
- 2928 Meister Rd SW
- 00 Cincinnati-Zanesville Rd SW
- 6008 Hopewell Church Rd SW
- 2770 Boice Rd SW
- 4911 Jacklin Dr
- 0 Heigle Rd SW Unit 226002378
- 0 Heigle Rd SW Unit 226002379
- 10527 Garrett Rd SW
- 5440 Winchester Southern Rd Unit Lot 8
- 681 Mount Zion Rd SW
- 8245 Royalton Rd SW
Your Personal Tour Guide
Ask me questions while you tour the home.